
Most SaaS teams know how many demos they booked last month. Far fewer know why some demos consistently convert while others never move beyond the first meeting.
I’ve audited demo processes where teams celebrated 200 bookings a month—while their demo-to-close rate sat at 6%. They were measuring activity, not effectiveness. Demo analytics is the process of measuring how prospects move through the entire demo journey, from request to closed deal. It helps SaaS teams evaluate qualification quality, demo effectiveness, buyer engagement, follow-up performance, and revenue impact to continuously improve conversions.
By the end of this guide, you’ll have four original frameworks—a scoring model, a metrics dashboard, a review cadence, and an audit checklist—to turn your demo data from a vanity report into an operational system that actually moves revenue.
Pre-Flight Check: Are You Ready to Measure?
Before tracking anything, confirm two things. First, do you have a single source of truth for demo outcomes? If your CRM says “demo completed” but nobody records what happened next, you’re not ready. Second, can your team agree on what counts as a “qualified” demo request versus a tire-kicker?
Stop/Go test: If you can’t describe your ideal demo lead in one sentence, pause here and align with your sales team on qualification criteria before building dashboards.
What Is Demo Analytics?
Demo analytics is the discipline of tracking, measuring, and interpreting data across the full demo lifecycle—not just counting bookings.
Basic sales reporting tells you how many demos happened. Demo analytics tells you which demos created pipeline, where leads dropped off, why attendance dipped, and how follow-up latency killed deals you never knew you lost.
The difference matters. A booking report shows 50 demos last week. Demo analytics reveals that 25% of those were ghost leads who never attended, that follow-up latency averaged 26 hours (killing 60% of potential deals), and that demos sourced from high-intent requests closed at 3x the rate of cold outbound.
Why Demo Analytics Matters
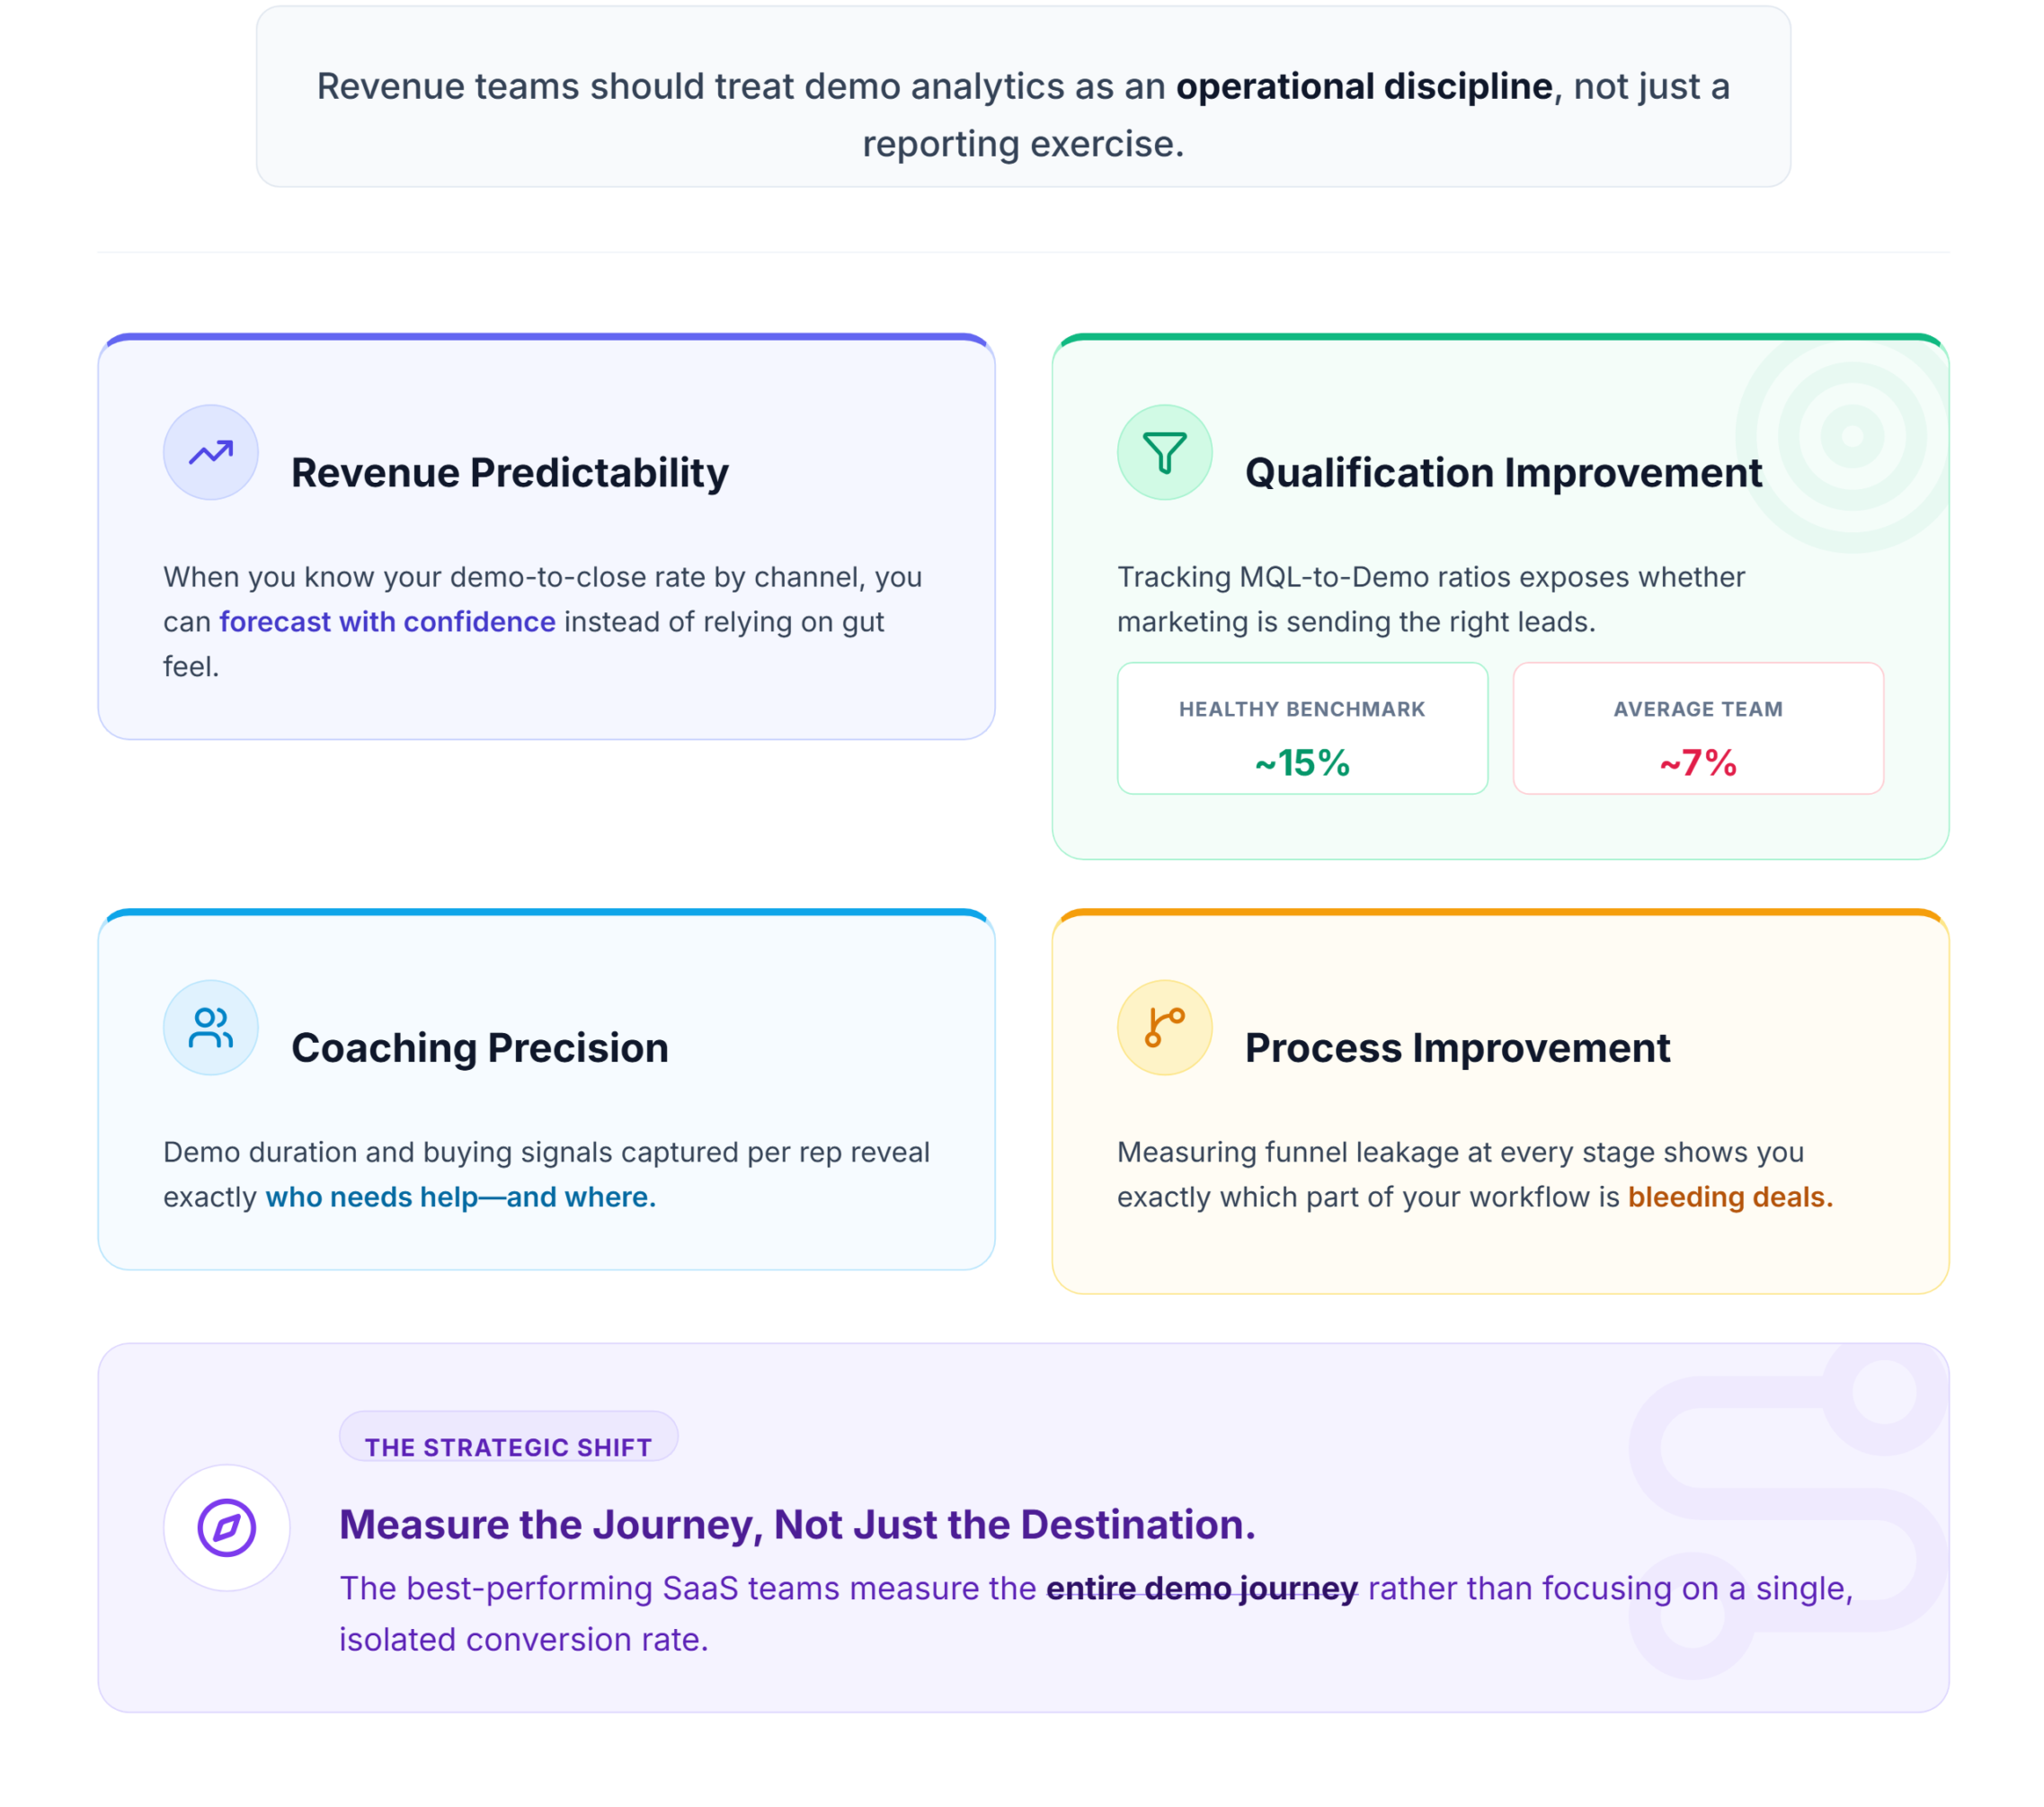
Revenue teams should treat demo analytics as an operational discipline, not just a reporting exercise. Here’s why:
Revenue predictability. When you know your demo-to-close rate by channel, you can forecast with confidence instead of gut feel.
Qualification improvement. Tracking MQL-to-Demo ratios (a healthy benchmark is around 15%, though most teams sit near 7%) exposes whether marketing is sending the right leads.
Coaching precision. Demo duration and buying signals captured per rep reveal who needs help—and where.
Process improvement. Measuring funnel leakage at every stage shows you exactly which part of your workflow is bleeding deals.
The best-performing SaaS teams measure the entire demo journey rather than focusing on a single conversion rate.
The Demo Analytics Pyramid
Think of demo performance as a pyramid. Each layer feeds the one above it:
Improving lower-stage metrics compounds upward. If you increase your demo attendance rate from 55% to 78% (achievable with SMS reminders, based on industry data), you don’t just get more attended demos—you get more opportunities, more pipeline, more revenue. Every percentage point at the base multiplies through the pyramid.
Most teams obsess over the top. Start at the bottom.
The Demo Analytics Dashboard
This is your operational centerpiece. Print it. Pin it to your wall. Review it weekly.
| KPI | Why It Matters | Good Benchmark | Review Frequency |
|---|---|---|---|
| Demo Requests | Volume of inbound interest | Varies by GTM motion | Weekly |
| Qualified Rate | Signal-to-noise ratio of requests | 40–60% | Weekly |
| Booking Rate | Conversion from request to scheduled demo | 60–75% | Weekly |
| Attendance Rate | Shows if leads actually show up | 75–85% | Weekly |
| Avg. Response Time | Speed kills—or creates—deals | Under 5 minutes (ideal) | Daily |
| Demo Duration | Engagement depth vs. efficiency | 25–45 min | Monthly |
| Questions Asked | Buyer engagement signal | 4–8 per demo | Monthly |
| Stakeholder Participation | Multi-threading indicator | 2+ attendees | Weekly |
| Follow-up Time | Post-demo momentum | Under 2 hours | Daily |
| Proposal Rate | Demo-to-proposal conversion | 30–50% | Monthly |
| Demo-to-Opportunity | Pipeline creation rate | 40–60% | Monthly |
| Demo-to-Close | Revenue conversion | 15–25% | Monthly |
| Sales Cycle Length | Time from demo to close | 14–45 days (SMB) | Quarterly |
| Revenue Influenced | Dollar value tied to demos | Track per channel | Quarterly |
| Pipeline Created | Forward-looking revenue indicator | Track per rep | Monthly |
| Win Rate | Closed-won vs. total opportunities | 20–30% | Quarterly |
Benchmarks vary significantly by deal size, market segment, and sales motion. Use these as starting points, not absolutes.
Vanity Metrics vs. Actionable Metrics
A high demo volume means little if qualification quality and stakeholder engagement remain low. Here’s the distinction:
| Vanity Metric ❌ | Actionable Metric ✅ | Why |
|---|---|---|
| Total demos booked | Qualified demos completed | Bookings without qualification inflate activity |
| Long demo duration | Buying signals captured | A 60-minute demo with zero questions is a monologue |
| Total meetings held | Revenue influenced per demo | Meetings don’t pay the bills |
| Demo requests volume | MQL-to-Demo conversion rate | Raw volume hides lead quality problems |
| Emails sent post-demo | Follow-up latency (hours) | Speed matters more than volume |
How High-Performing SaaS Teams Review Demo Analytics
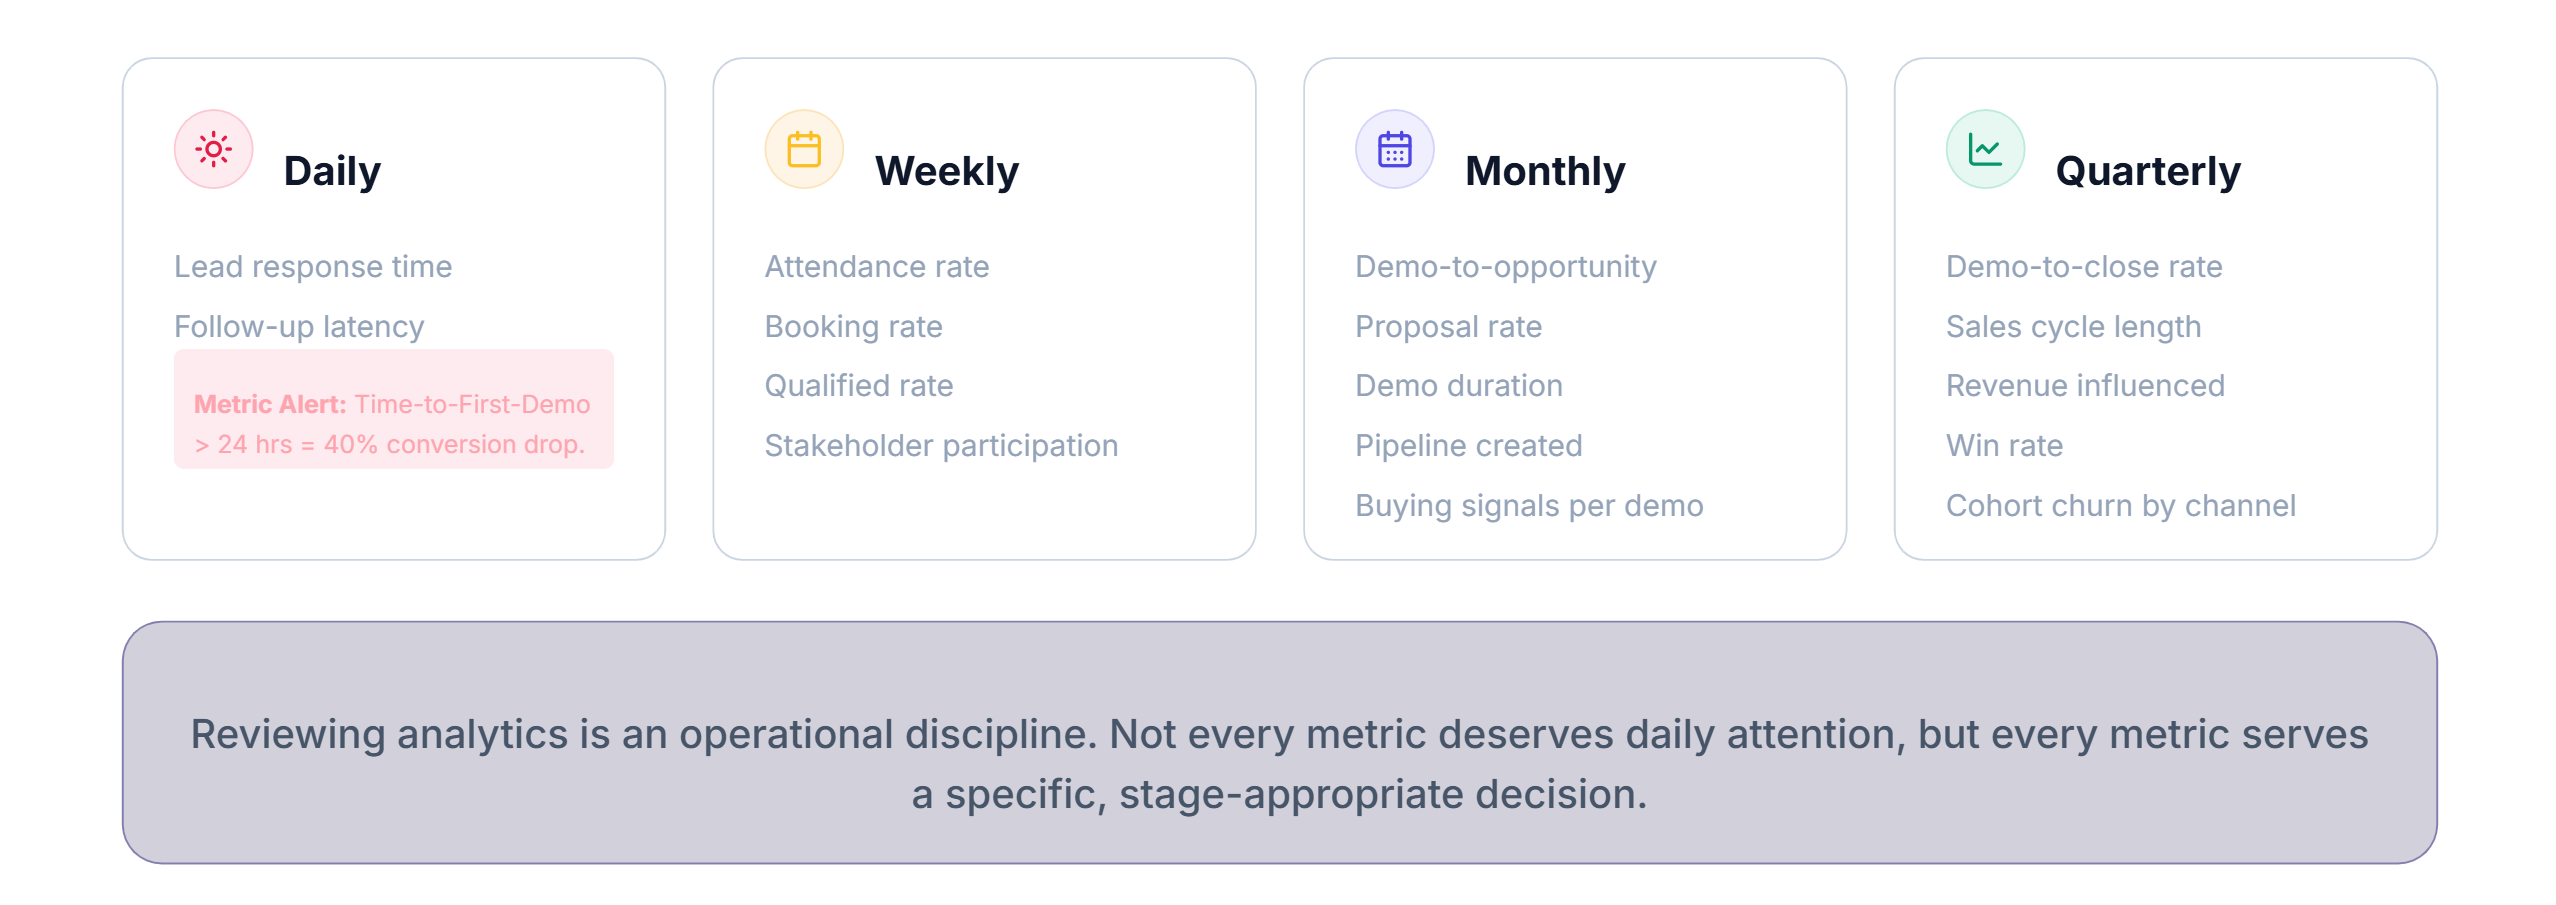
Not every metric deserves daily attention. Here’s the cadence that works:
Daily: Lead response time and follow-up latency. These are perishable. If Time-to-First-Demo exceeds 24 hours, conversion drops by roughly 40%. Check your queue every morning.
Weekly: Attendance rate, booking rate, qualified rate, and stakeholder participation. These reveal whether your demo scheduling and qualification workflows are holding.
Monthly: Demo-to-opportunity, proposal rate, demo duration, pipeline created, and buying signals per demo. This is where coaching conversations happen.
Quarterly: Demo-to-close rate, sales cycle length, revenue influenced, win rate, and cohort churn by channel. This is strategic. You’re deciding where to invest budget and headcount.
Demo Health Score
Score each demo on a 100-point scale to separate strong pipeline from noise:
| Factor | Max Points | What You’re Measuring |
|---|---|---|
| Lead Quality | 20 | PQL signals, firmographic fit, activation score |
| Attendance | 15 | Did they show? Were decision-makers present? |
| Engagement | 20 | Questions asked, feature interest, objections raised |
| Buying Signals | 15 | Timeline mentioned, budget discussed, competitor comparison |
| Next Steps | 15 | Clear action items, follow-up scheduled, stakeholders identified |
| Proposal Progress | 15 | Proposal requested, pricing discussed, procurement involved |
| Total | 100 |
Interpreting your score:
- 80–100: High-velocity deal. Prioritize and fast-track.
- 60–79: Solid opportunity. Needs nurturing and multi-threading.
- 40–59: At risk. Investigate qualification gaps or missing stakeholders.
- Below 40: Likely dead. Re-qualify or move to nurture sequence.
Calculate this for your last 10 demos. The pattern will tell you more than any pipeline report.
Common Demo Analytics Mistakes
Tracking only bookings. Bookings without attendance data are meaningless. Your ghost lead rate could be 25%—one in four booked leads never showing up—and you’d never know.
Ignoring follow-up latency. I’ve seen teams where the average post-demo follow-up was 26 hours. Data suggests 60% of deals die when follow-up exceeds 2 hours. Two hours. Not two days.
No source attribution. If you can’t segment demo-to-close rate by channel, you’re spending blind. Organic leads might close at 8% while paid channel leads close at 22%.
No stakeholder visibility. A demo with one junior user is fundamentally different from a demo with two decision-makers. If you’re not tracking multiple stakeholder participation, you’re missing the single best predictor of deal velocity.
Reviewing metrics in isolation. A 90% attendance rate means nothing if your demo-to-opportunity rate is 15%. Connect the stages.
Not measuring engagement. Demo duration alone is a vanity metric. A 20-minute demo with six buying signals beats a 50-minute demo where the prospect was on mute.
Demo Analytics Audit Checklist
Run this quarterly. Score yourself honestly.
- ✓ Are demo requests tagged by source and campaign?
- ✓ Is lead qualification tracked before demo booking?
- ✓ Is attendance rate measured and reported weekly?
- ✓ Are no-shows followed up within 24 hours?
- ✓ Is follow-up latency tracked per rep?
- ✓ Are buying signals recorded after every demo?
- ✓ Are demos scored using a standardized framework?
- ✓ Is stakeholder participation logged?
- ✓ Are conversion stages measured (request → booked → attended → opportunity → closed)?
- ✓ Is demo-to-close rate segmented by channel?
- ✓ Is lead response time under 5 minutes for inbound requests?
- ✓ Are demo outcomes tracked (won, lost, in follow-up, pending)?
- ✓ Is pipeline created attributed to specific demos?
- ✓ Is sales cycle length measured from first demo?
- ✓ Are ghost leads identified and re-engaged automatically?
- ✓ Is zero-party data from demo forms used for personalization?
- ✓ Are reps coached using demo-level engagement data?
- ✓ Is there a single dashboard showing all demo KPIs?
If fewer than 12 boxes are checked, your demo analytics practice has significant blind spots.
The “Ugly Truth” About Demo Data
Here’s what most guides won’t tell you:
| Problem | Root Cause | The Fix That Actually Works |
|---|---|---|
| High ghost lead rate (25%+) | No SMS reminders, poor calendar UX | Add SMS reminders 1 hour before; ghost rate drops ~40% |
| Low attendance despite high bookings | Complex booking flow, no timezone auto-detect | Simplify to 2-step booking with timezone detection |
| Follow-up falls through cracks | Manual CRM entry, no automation | Auto-create follow-up tasks via workflow automation; latency drops to under 1 hour |
| Inflated SQL counts | Sales counting leads who never attended demos | Require demo attendance as SQL qualification criteria |
| 30% of leads have bad contact data | No email validation on forms | Add real-time email validation; follow-up failure drops immediately |
These aren’t edge cases. They’re the norm for most teams under 50 people.
Your demo data shouldn’t live in five different tools.
If you’re piecing together demo analytics from spreadsheets, calendar apps, and CRM notes, LevelUp Demo centralizes your demo workflow—from request capture through outcome tracking—so you can actually see what’s working.
How LevelUp Helps Improve Demo Analytics
Improving demo performance starts with measuring the right behaviors, not just the final outcomes. LevelUp Demo was built for small SaaS teams who need centralized reporting without CRM complexity.
It connects the dots most tools miss: qualification visibility at the point of request, workflow insights that show where leads stall, routing analytics that reveal assignment bottlenecks, and conversion tracking from first touch to closed deal. The analytics dashboard surfaces the exact KPIs from the framework above—attendance, follow-up latency, outcome tracking, and pipeline attribution—without requiring a RevOps team to build custom reports.
It’s not an analytics platform. It’s a demo operations layer that happens to make analytics possible by capturing the right data at every stage.
FAQ
What is demo analytics?
Demo analytics is the practice of measuring how prospects move through the demo journey—from initial request to closed deal. It covers qualification quality, attendance, engagement, follow-up speed, and revenue attribution, giving SaaS teams the data to continuously improve demo conversions.
Which demo KPIs matter most?
The highest-impact KPIs are demo-to-close rate, follow-up latency, attendance rate, stakeholder participation, and revenue influenced. These connect activity to outcomes rather than measuring volume alone.
What is a good demo attendance rate?
Teams with automated reminders (especially SMS) typically see 75–85% attendance. Without reminders, attendance often drops to 55%. If your rate is below 70%, your reminder workflow needs immediate attention.
How often should demo analytics be reviewed?
Follow-up latency and response time should be monitored daily. Attendance and booking rates weekly. Pipeline and conversion metrics monthly. Revenue impact and sales cycle length quarterly.
Which teams should own demo analytics?
Sales and RevOps share ownership. Sales owns execution-level metrics (attendance, engagement, follow-up). RevOps owns system-level metrics (conversion rates, pipeline attribution, process health). Both report to revenue leadership.
What metrics improve demo conversions?
Focus on lead response time (under 5 minutes), follow-up latency (under 2 hours), stakeholder participation (2+ attendees), and buying signals captured per demo. These behavioral metrics have the strongest correlation with closed revenue.
LevelUp Demo
Ready to stop guessing about demo performance?
Start your free LevelUp Demo trial and see every metric from this guide in one dashboard.