
“We need more demos.”
I hear this from founders every single week. Pipeline’s thin, revenue’s behind plan, and the instinct is always the same—crank the top of the funnel. Book more calls. Fill more calendar slots.
Here’s the problem: I’ve audited demo programs across dozens of B2B SaaS companies, and the teams sitting at 40–60% demo win rates aren’t booking more demos than the teams stuck below 20%. They’re running better demos. Better qualified, better prepared, better followed up. The gap between high-performing and low-performing demo programs almost never lives at the volume layer. It lives in the system underneath.
This piece breaks down exactly where demo conversions leak, how to diagnose your specific bottlenecks, and what a 90-day improvement roadmap looks like when you stop chasing volume and start fixing quality.
What Is Demo Win Rate and Why Does It Matter?
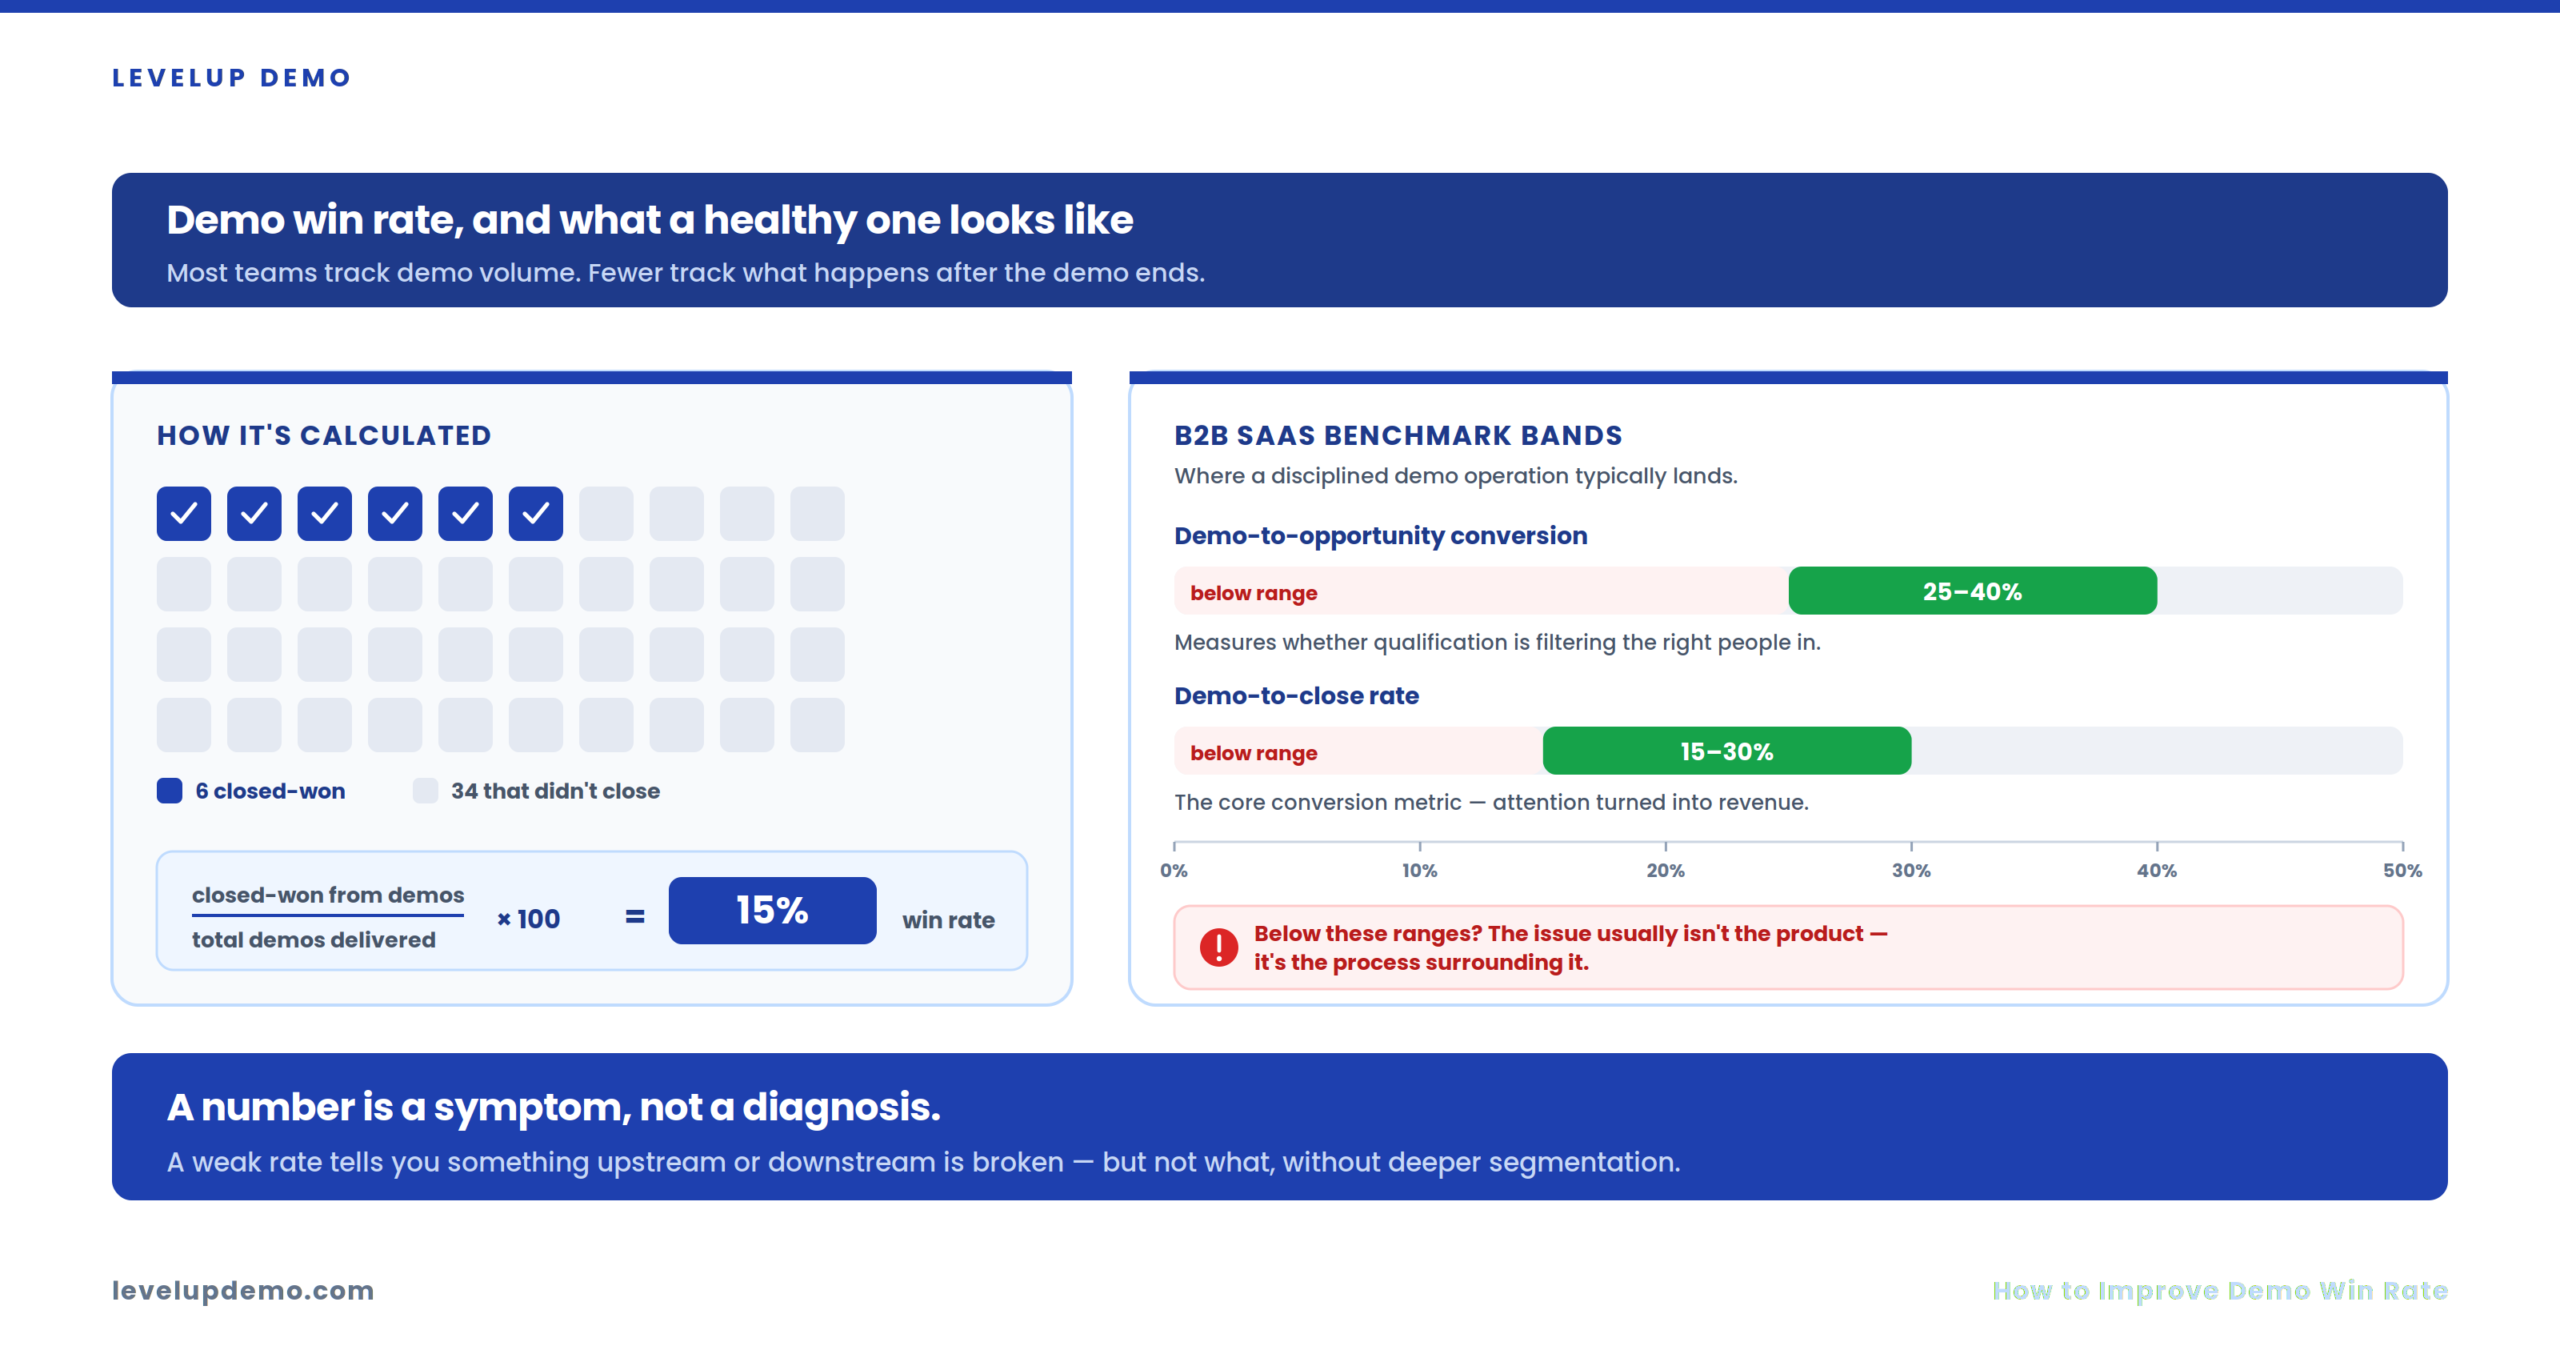
Demo win rate measures the percentage of completed product demonstrations that convert into closed-won revenue. It’s calculated by dividing closed-won deals originating from demos by total demos delivered, then multiplying by 100. Tracking your demo win rate over time is one of the clearest indicators of whether your sales process is becoming more effective or simply generating more activity.
Most teams track demo volume. Fewer track what happens after the demo ends. And that’s where the disconnect lives.
A strong demo-to-close rate tells you your demo qualification framework is working, your reps are executing, and your follow-up process has teeth. A weak one tells you something upstream or downstream is broken—but it won’t tell you what without deeper segmentation.
For B2B SaaS companies, benchmarks vary by deal size and sales cycle, but teams running a disciplined demo operation typically see 25–40% demo-to-opportunity conversion and 15–30% demo-to-close rates. If you’re below those ranges, the issue usually isn’t the product. It’s the process surrounding it.
Why More Demos Don’t Always Mean More Revenue
Increasing demo volume without improving conversion dilutes your pipeline and exhausts your team. Every unqualified demo costs 45–60 minutes of selling time, follow-up effort, and emotional bandwidth—resources that could go toward prospects who actually close.
I was looking at the data on this recently, and it’s wild: teams that improve demo win rate by just 10 percentage points often generate more incremental revenue than teams that double their demo volume. The math isn’t complicated. If you’re running 40 demos a month at a 15% close rate, that’s 6 deals. Improve to 25% on the same 40 demos? That’s 10 deals. No additional headcount. This is why improving demo win rate usually delivers a higher ROI than simply increasing demo volume. No extra ad spend. No more calendar Tetris.
The real bottleneck for most 1–5 person sales teams isn’t getting people on calls. It’s that tire-kickers are clogging the calendar, discovery is shallow, and follow-up is inconsistent. Fixing those three things changes the economics of your entire pipeline.
The LevelUp Demo Win Rate Optimization Framework
Improving demo conversion requires a system across six stages—not a single tactic applied in isolation. Here’s how each stage breaks down:
1Qualification (Foundation of a High Demo Win Rate)
The most common mistake is a booking form that’s too short or too generic. If your form doesn’t filter by company size, role, use case, or budget intent, you’re scheduling calls with people who were never going to buy.
Key metric: qualified-demo-to-booked-demo ratio. Target 70%+.
2Preparation
Reps who walk into demos without reviewing the prospect’s stated pain points, company context, or previous interactions deliver generic product tours. Build a one-page demo brief from discovery notes.
Key metric: prep time per demo (aim for 10–15 minutes minimum).
3Delivery
The demo should start with the buyer’s problem restated in their words—not a “quick overview of the platform.” Show three or four capabilities tied to measurable outcomes. Broad feature tours dilute urgency.
Key metric: talk-to-listen ratio (under 65% rep talk time).
4Buyer Engagement
Stakeholder attendance matters enormously. Demos where only one contact attends close at roughly half the rate of demos with two or more stakeholders present.
Key metric: average stakeholder count per demo.
5Follow-Up
Same-day follow-up with a personalized recap outperforms “I’ll send something over this week” by a significant margin. Score each demo A/B/C and route accordingly—A-tier gets direct outreach, B-tier gets automation, C-tier goes to nurture.
Key metric: time-to-first-follow-up.
6Continuous Optimization
Review demo recordings, coach on objection handling, and track win rate by AE, by industry, and by demo type monthly.
Key metric: month-over-month win rate trend.
The Demo Conversion Funnel
Most teams measure “demos booked” and “deals closed.” Improving demo win rate requires optimizing every stage of the funnel rather than focusing only on the final close rate. The seven stages between those points are where conversion actually lives—or dies.
→
Qualified Demo
→
Demo Completed
→
Stakeholder Engagement
→
Proposal
→
Negotiation
→
Closed Won
Where do teams typically bleed?
Booked to Qualified: 20–40% of booked demos shouldn’t have been booked. ICP qualification and lead scoring logic applied before confirmation solves this.
Qualified to Completed: No-shows. A confirmation page that pre-sells value—ideally with a short video—drops no-show rates measurably. The booking moment is the highest-intent point. Treating it as administrative is a miss.
Completed to Stakeholder Engagement: Single-threaded deals stall. If only one person attended the demo, the internal champion has to re-sell your product without you in the room. That rarely works.
Proposal to Closed Won: This is where understanding why buyers ghost after product demos becomes critical. Deals die in silence, not in objection.
Diagnose your specific funnel by tracking conversion rates between each stage for 30 days. The bottleneck will reveal itself.
10 Proven Ways to Improve Demo Win Rate
The Demo Performance Scorecard
Rate each demo on a 1–5 scale across eight dimensions:
A score below 24/40 signals systemic execution issues. Use this scorecard during weekly coaching sessions to track improvement over time.
The Win Rate Diagnostic Matrix
When win rates are low, the cause isn’t always obvious. This matrix helps you isolate the problem:
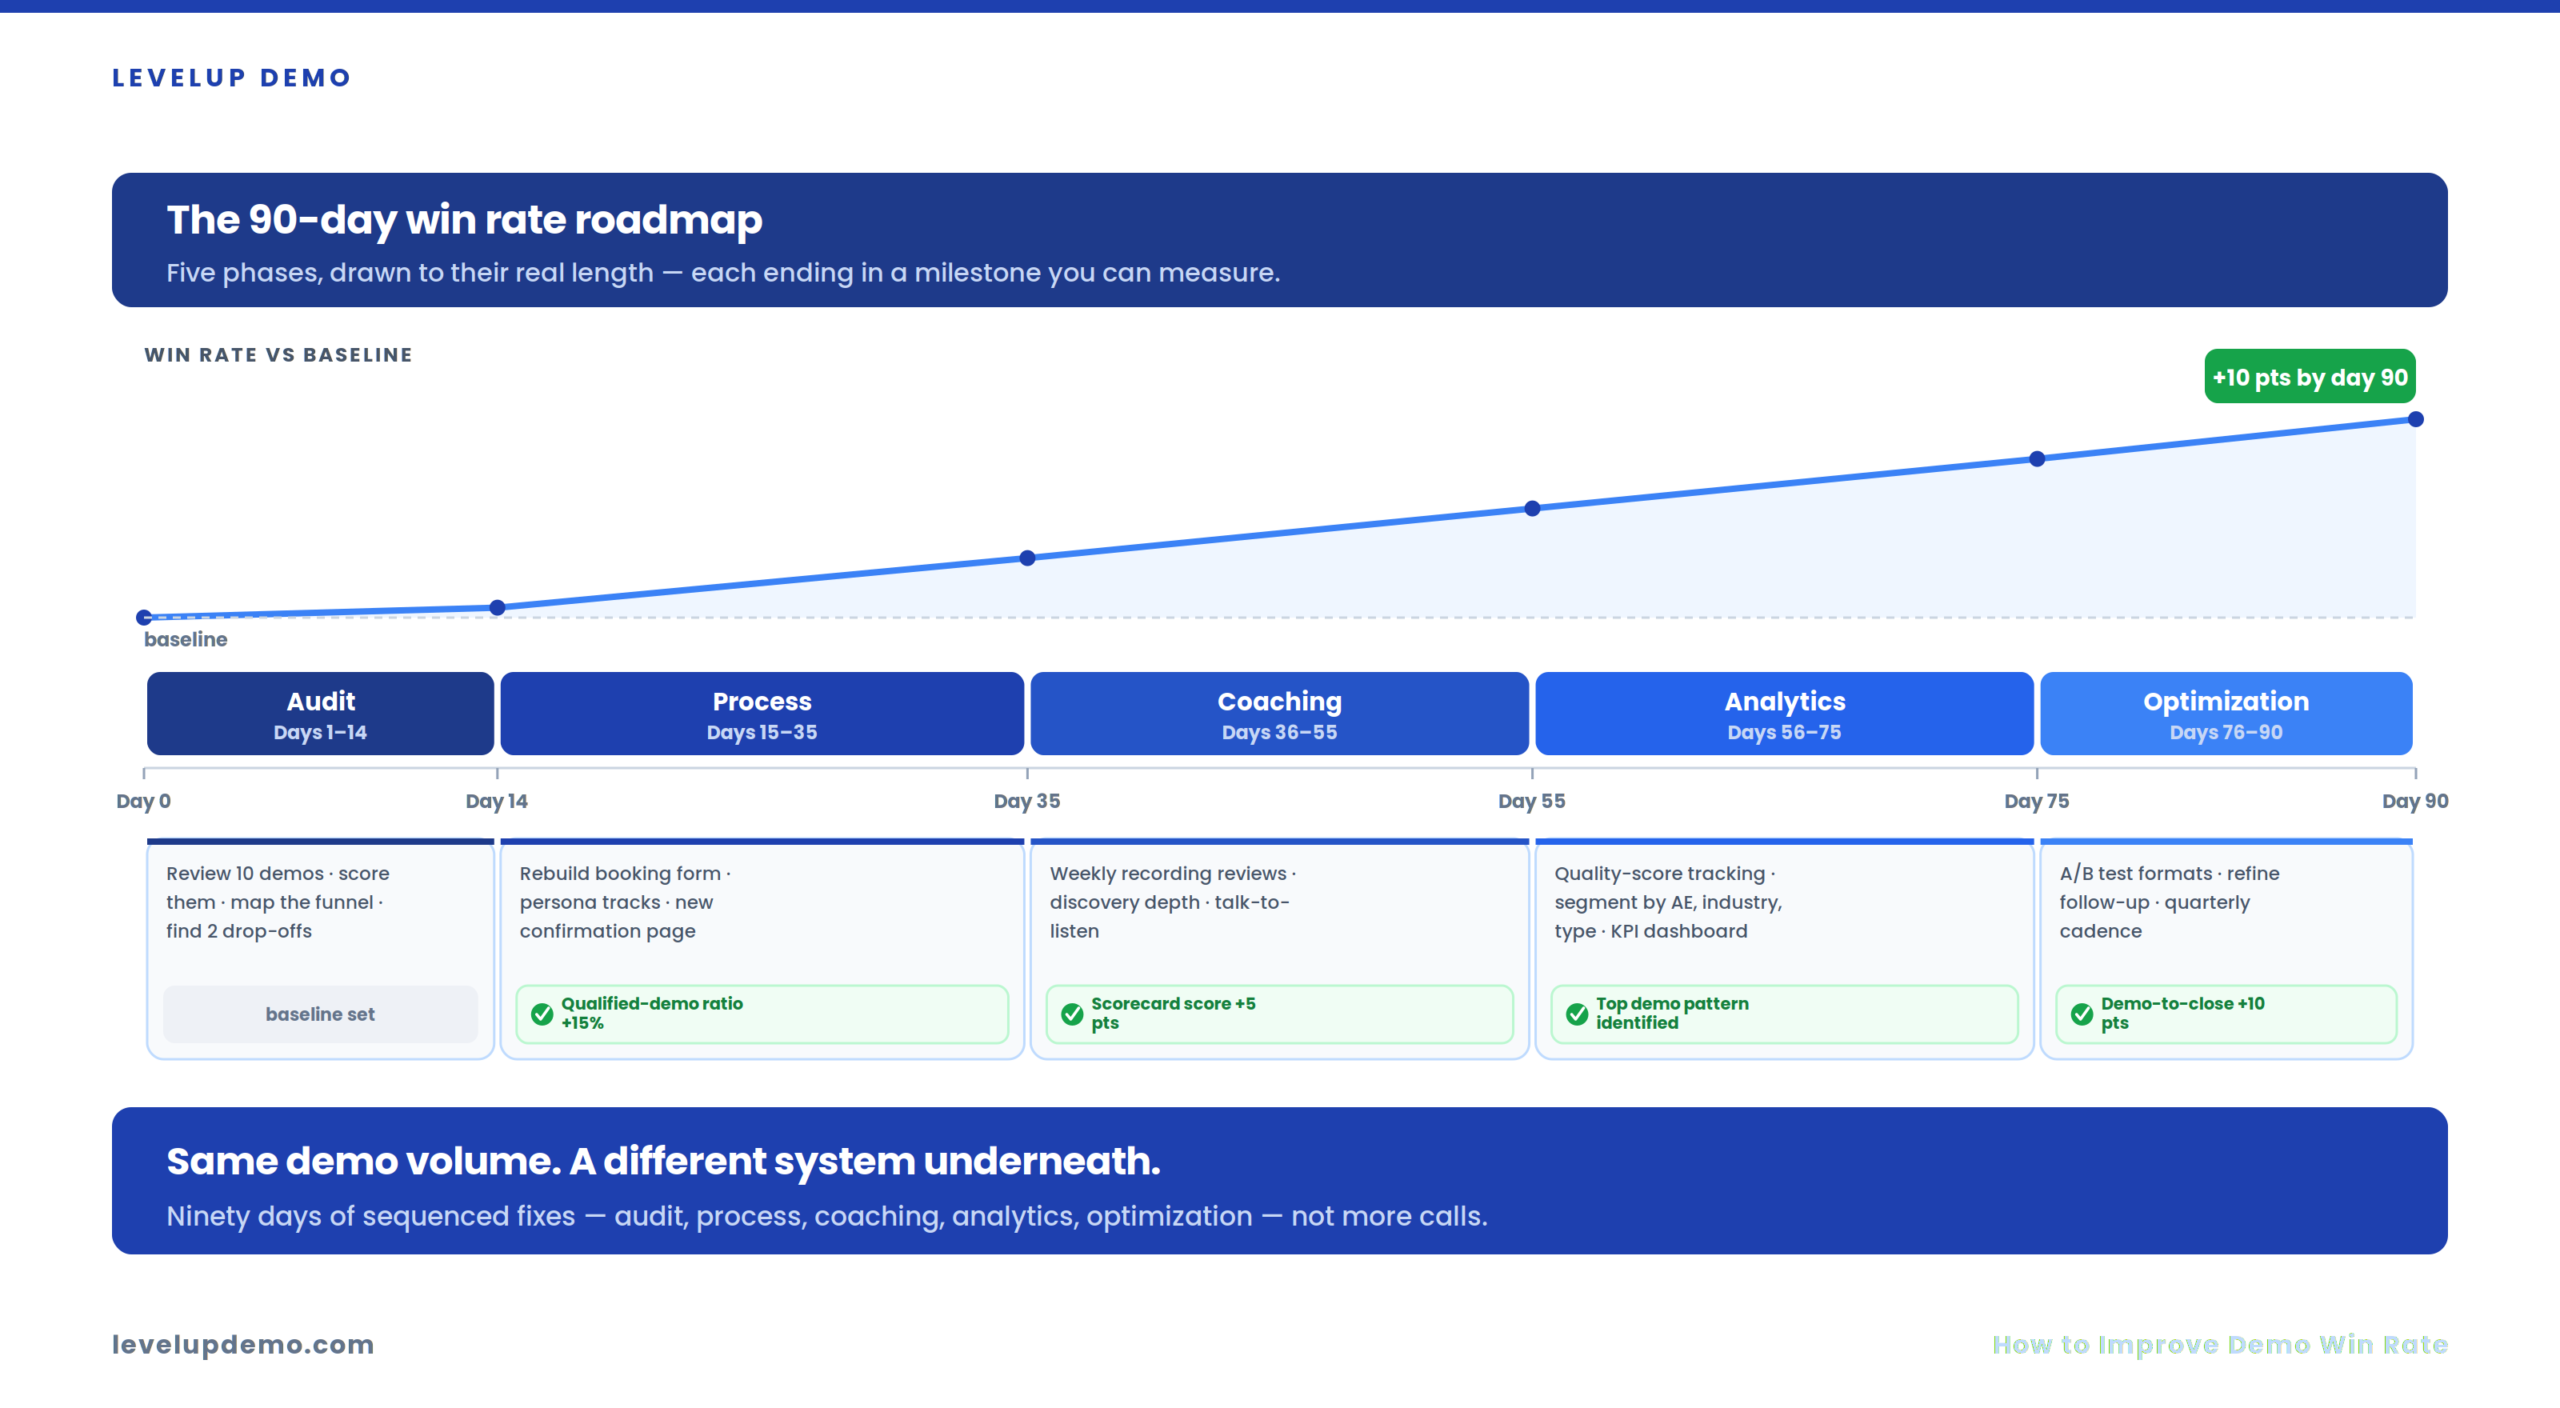
The 90-Day Demo Win Rate Improvement Roadmap
Phase 1 – Audit (Days 1–14)
Record and review 10 recent demos. Score them using the Performance Scorecard. Map your current conversion funnel. Identify the two biggest drop-off points.
Phase 2 – Process Improvements (Days 15–35)
Rebuild your booking form with ICP qualification logic. Create persona-based demo tracks. Redesign confirmation page and email.
Milestone: qualified-demo ratio increases by 15%+.
Phase 3 – Coaching (Days 36–55)
Run weekly recording reviews. Focus on discovery depth, talk-to-listen ratio, and next-step commitment.
Milestone: average Scorecard score increases by 5+ points.
Phase 4 – Analytics (Days 56–75)
Implement demo quality score tracking. Segment win rate by AE, industry, and demo type. Build your Executive KPI Dashboard.
Milestone: you can identify your top-performing demo pattern.
Phase 5 – Optimization (Days 76–90)
A/B test demo formats (live vs. hybrid vs. async). Refine follow-up sequences based on A/B/C scoring data. Set quarterly review cadence.
Milestone: demo-to-close rate improves by 10+ percentage points vs. baseline.
Executive Demo KPI Dashboard
Track these ten metrics to maintain operational visibility:
Review weekly. Act monthly.
How LevelUp Helps Teams Improve Demo Win Rates
For small SaaS teams running demos without a dedicated RevOps function, the operational gap between “knowing what to fix” and “actually fixing it” is real. LevelUp closes that gap by centralizing lead capture, qualification, scheduling, outcome tracking, and follow-up management in one lightweight workflow—without requiring a CRM migration or enterprise-grade complexity. If you’re running the frameworks above and need a system to hold the process together, it’s worth exploring how it works.
Fix the system, not the volume.
LevelUp centralizes qualification, scheduling, outcome tracking, and follow-up in one lightweight workflow—so you can run the frameworks above without a CRM migration or a RevOps hire.
FAQ
What is a good demo win rate for B2B SaaS?
A healthy demo-to-close rate for B2B SaaS typically falls between 15–30%, depending on deal size and sales cycle length. Teams with strong qualification and follow-up processes often reach 25–40% demo-to-opportunity rates. If you’re consistently below 15%, the issue is almost always upstream—qualification, preparation, or stakeholder coverage.
How do you calculate demo win rate?
Divide the number of closed-won deals that originated from a demo by the total number of demos delivered in the same period. Multiply by 100. Track this monthly and segment by AE, industry, and deal size to surface actionable patterns.
Why are our demos not converting?
The most common causes are weak qualification (wrong people booking), generic delivery (feature tours instead of problem-focused demos), single-threaded deals (only one stakeholder involved), and slow follow-up. Use the Win Rate Diagnostic Matrix above to isolate your specific bottleneck.
What role does follow-up play in demo conversion?
Follow-up is where most deals are won or lost. Same-day personalized recaps with a mutual action plan dramatically outperform delayed, templated emails. Scoring demos A/B/C and differentiating follow-up intensity ensures your best opportunities get the attention they deserve.
Should every demo be personalized?
Yes—but the depth of personalization should match the lead’s qualification tier. A-tier prospects get fully customized demo briefs. B-tier gets persona-based tracks. C-tier might get an async video or self-serve experience before earning synchronous time. The goal is proportional effort, not uniform effort.
How often should demo performance be reviewed?
Weekly for KPIs and coaching. Monthly for process adjustments. Quarterly for strategic decisions like ICP changes or demo format experiments. Teams that review monthly miss patterns that compound over weeks.
What’s the one stage in your demo process where you suspect the biggest drop-off is happening—and when was the last time you actually measured it?