I spent six weeks last quarter helping a 12-person SaaS team figure out why their pipeline was dying. They were running 40+ demos a month. Decent volume. But closed revenue? Flat. Their CRM had a “Demo Completed” checkbox and literally nothing else. No attendance tracking, no follow-up timestamps, no ICP scoring. They were flying blind and bleeding deals at every stage.
The fix wasn’t more demos. It was measuring the right things about the demos they already had.
By the end of this guide, you’ll have a complete framework for selecting, assigning, and reviewing the 20 demo operations KPIs that actually move revenue—not just the vanity metrics that look good in a slide deck.
What Are Demo Operations KPIs?
Demo operations KPIs are measurable indicators that help SaaS teams evaluate the efficiency and effectiveness of their demo process—from high-intent demo requests and qualification to attendance, conversion rates, and revenue generated. They differ from generic sales KPIs because they isolate the demo as a discrete revenue event with its own funnel, friction points, and optimization levers.
Most guides lump “demo conversion rate” into a broader sales metrics post and call it a day. That’s insufficient. Effective demo operations rely on a balanced set of KPIs across acquisition, qualification, execution, and conversion, rather than focusing on a single conversion rate.
Stop/Go Readiness Check: Can you answer “What percentage of our booked demos actually attend?” right now? If not, your tracking infrastructure needs work before KPI selection matters.
Why Demo KPIs Matter
Operational metrics like response time and attendance often predict future revenue performance before pipeline metrics do. Here’s the problem I keep seeing: teams track MRR and win rate religiously but treat the demo itself as a black box. Then they’re shocked when 45% of leads exit at the “No Response” stage post-demo and only 35% of demos convert to opportunities.
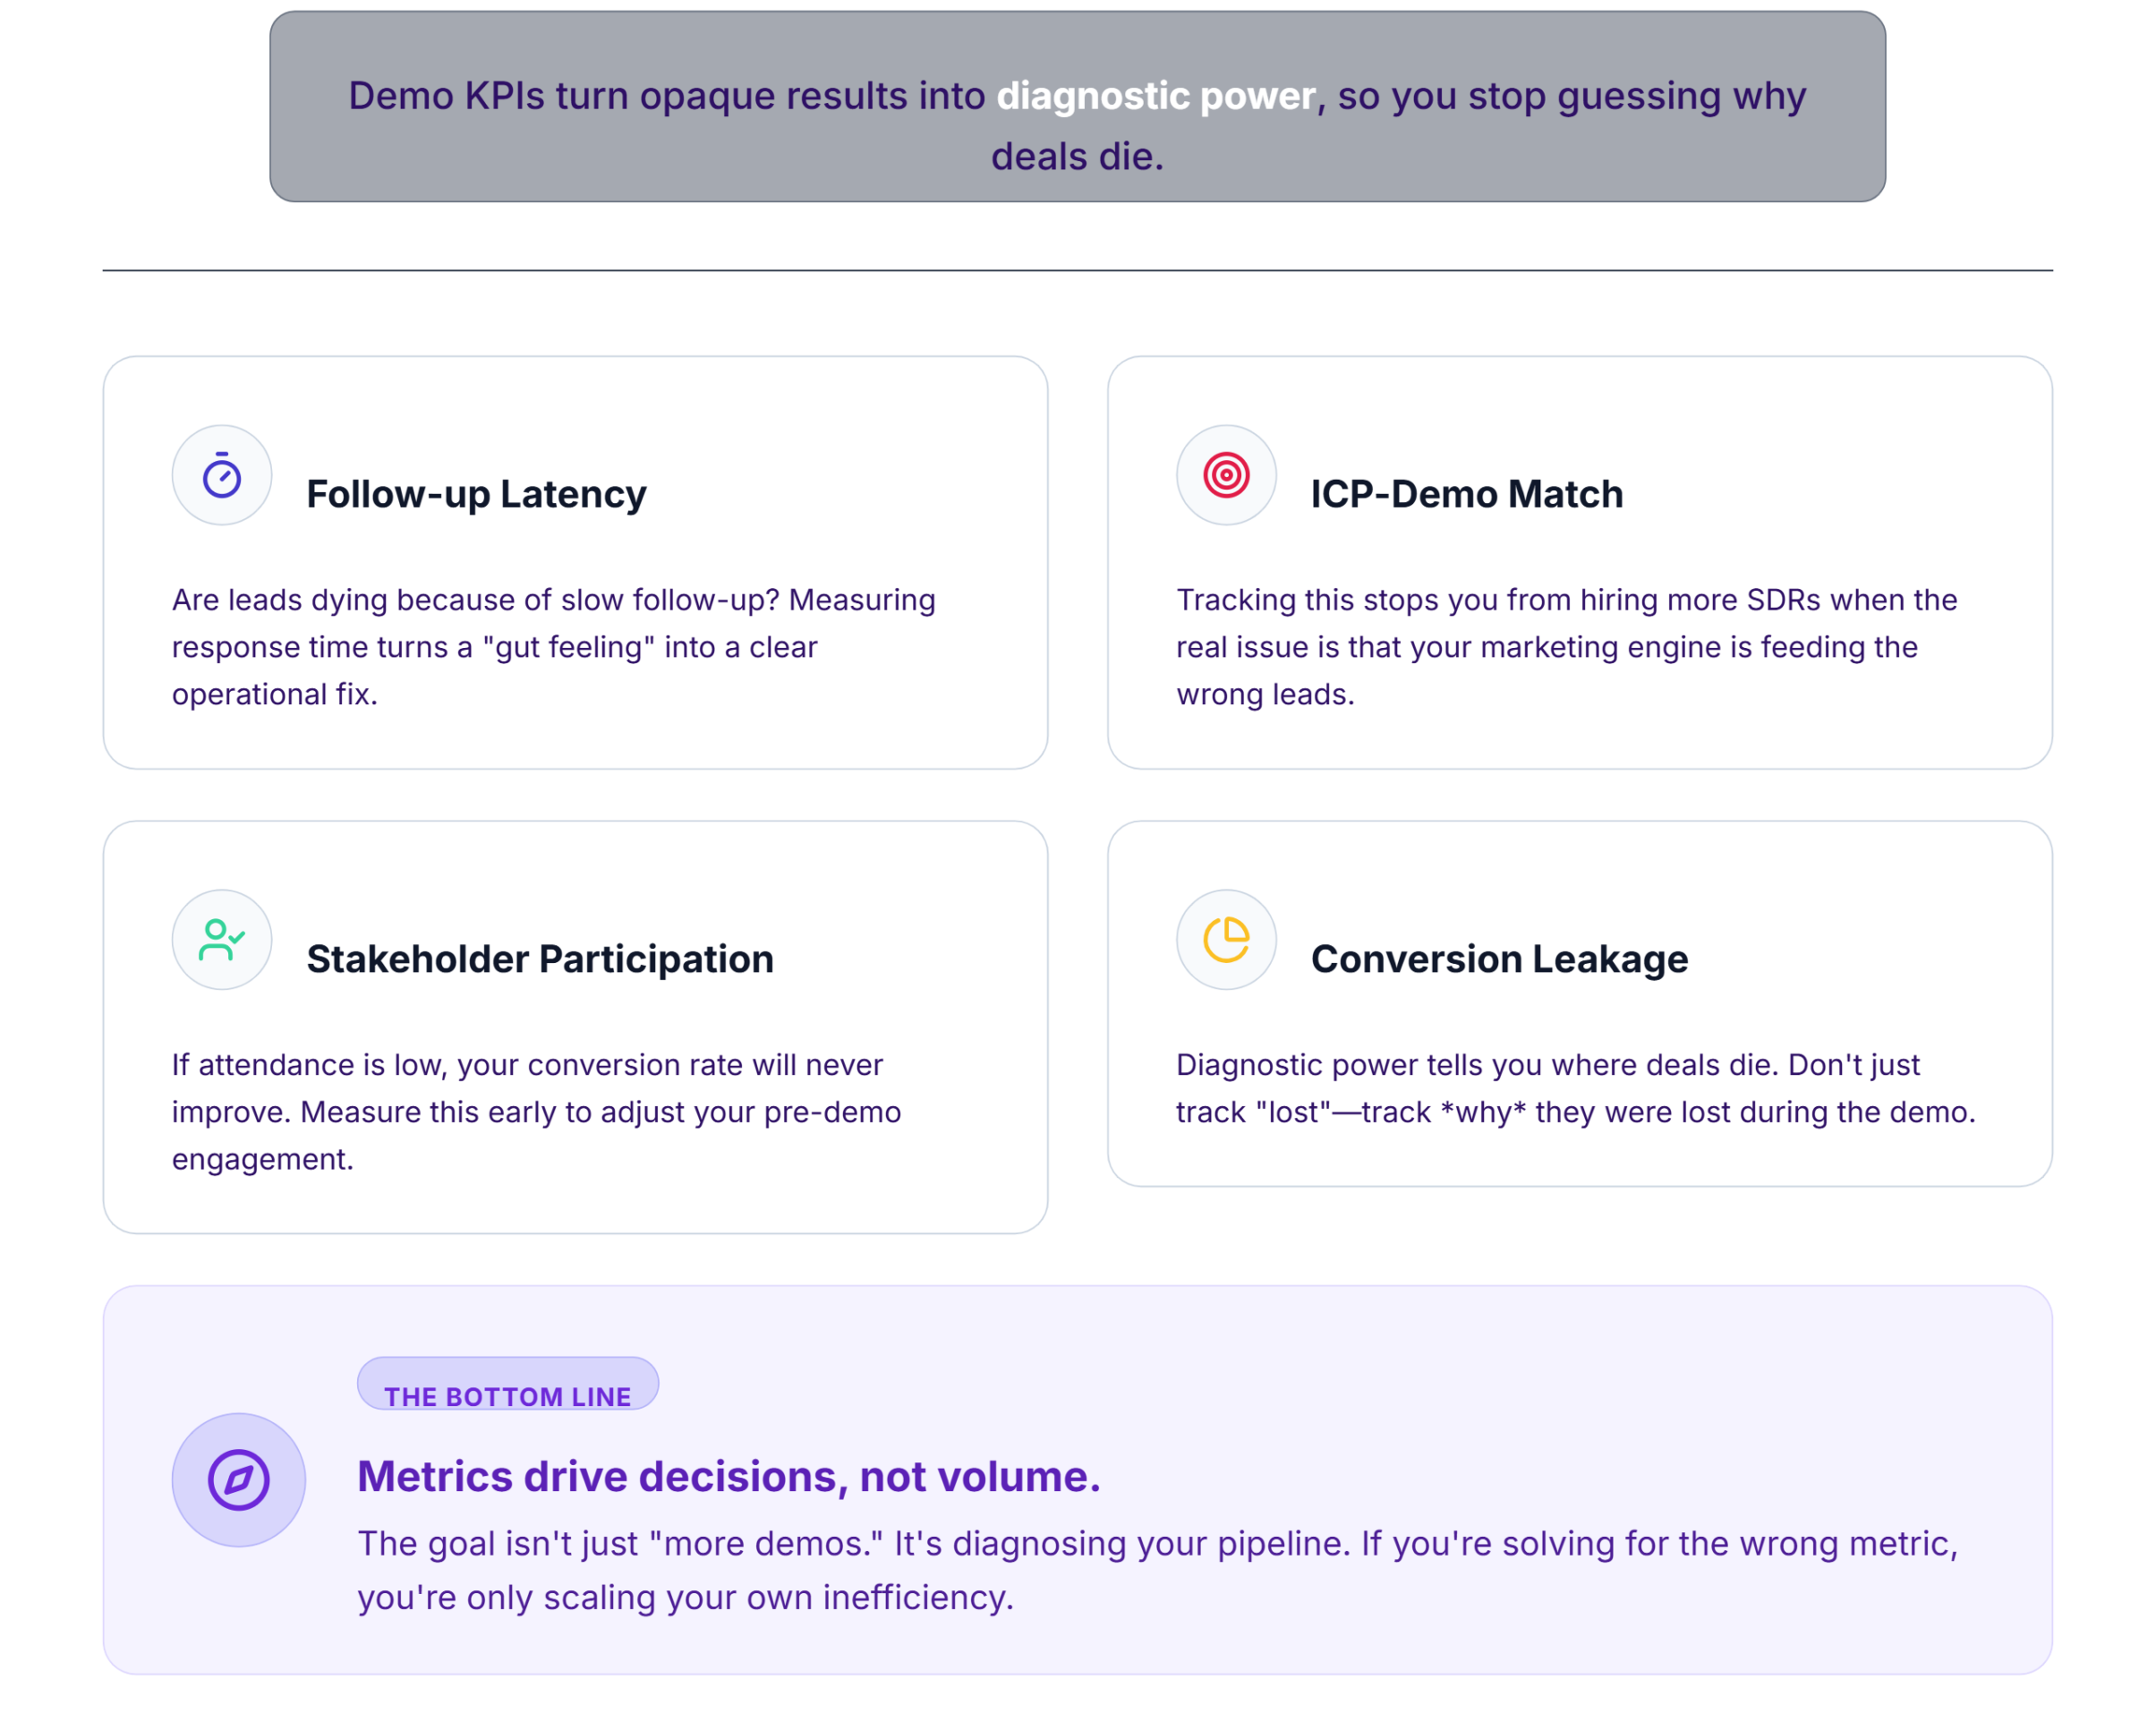
Demo KPIs give you diagnostic power. They tell you where deals die, not just that they died.
The best demo KPI frameworks connect daily sales activities to long-term revenue outcomes. Without them, you’re optimizing the wrong things—running more demos when the issue is follow-up latency, or hiring more SDRs when the issue is ICP-Demo Match.
The Demo Operations KPI Framework
Before listing individual metrics, you need a structural model. I’ve organized these 20 KPIs into six categories that mirror the actual demo lifecycle. Think of it as a diagnostic map.
| Category | What It Measures | KPIs |
|---|---|---|
| Acquisition | Demand generation into the demo funnel | Demo Request Volume, Demo Request Growth Rate, Source Quality Score |
| Qualification | Lead fitness before scheduling | Qualified Demo Rate, Lead Quality Score, Buying Signal Score |
| Scheduling | Friction between “yes” and “booked” | Booking Rate, Time-to-Schedule, Calendar Utilization |
| Execution | What happens during the demo | Attendance Rate, Demo Duration, Stakeholder Participation, Engagement Score |
| Conversion | Post-demo pipeline movement | Proposal Rate, Demo-to-Opportunity, Demo-to-Close, Sales Cycle Length, Revenue Influenced |
| Operational | Process health and accountability | Follow-up SLA Compliance, Response Time |
The 20 Most Important Demo KPIs
1. Demo Request Volume
Total inbound demo requests per period. Simple count. Matters because it’s your top-of-funnel signal. Pitfall: celebrating volume without checking source quality. Owner: Marketing/SDR.
2. Demo Request Growth Rate
Formula: ((Current Period Requests – Prior Period Requests) / Prior Period) × 100. Flat growth with increasing ad spend is a red flag. Owner: Marketing.
3. Source Quality Score
Not all demo booking channels are equal. Assign a 1–10 score per source based on downstream conversion. Organic search leads that convert at 25% shouldn’t be weighted the same as paid leads converting at 8%. Owner: RevOps.
4. Qualified Demo Rate
Formula: Qualified Demos / Total Requests × 100. If your SQL-to-Demo Ratio is below 60%, you’re either over-filtering or attracting the wrong audience. Without pre-demo qualification, teams see Demo Churn rates averaging 18%. Owner: SDR.
5. Lead Quality Score
A composite score (firmographic fit, budget signal, timing) applied before the demo is booked. Low ICP-Demo Match scores explain why 40% of demos go nowhere. Owner: SDR/RevOps.
6. Buying Signal Score
Track specific buying signals—pricing page visits, case study downloads, multi-stakeholder sign-ups. This is Zero-Party Demo Data collected from the lead’s own behavior. Owner: RevOps.
7. Booking Rate
Formula: Demos Booked / Qualified Leads × 100. High Demo Scheduling Friction—clunky forms, limited availability, timezone confusion—causes 30% of leads to abandon the booking flow. Owner: SDR.
8. Time-to-Schedule
Hours from demo request to confirmed booking. Every day of delay reduces conversion probability. If this number creeps past 48 hours, your demo scheduling tools need attention. Owner: SDR/Manager.
9. Calendar Utilization
Formula: Booked Demo Slots / Available Demo Slots × 100. Below 60% means wasted capacity. Above 90% means no buffer for high-priority prospects. Owner: Manager.
10. Attendance Rate
Formula: Attended Demos / Booked Demos × 100. A healthy benchmark is 80–85%. Ghost Rate spiking to 18% usually traces back to missing pre-demo qualification calls. A 2-minute “intent check” call before booking reduces ghosts by 40%. Owner: AE.
11. Demo Duration
Track actual runtime versus scheduled time. Demos running consistently short may indicate poor discovery. Demos running long may signal scope creep or weak objection handling. Owner: AE.
12. Stakeholder Participation
Count of unique stakeholders attending. Multiple stakeholder demos close at significantly higher rates. If you’re consistently presenting to a single contact, you’re not reaching decision-makers. Owner: AE.
13. Engagement Score
A Post-Demo Engagement Score below 3.0 predicts a 70% chance of deal loss. Measure: questions asked during demo, follow-up email opens, resource downloads, portal logins. Owner: AE/RevOps.
14. Proposal Rate
Formula: Proposals Sent / Demos Completed × 100. If this is below 40%, your demos aren’t generating enough conviction—or your AEs aren’t asking for the next step. Owner: AE.
15. Demo-to-Opportunity Conversion
Formula: Opportunities Created / Demos Completed × 100. Only 35% of demos convert to opportunities in underperforming teams. The fix is usually upstream: better ICP matching and discovery questions. Owner: AE/Manager.
16. Demo-to-Close Rate
Formula: Closed-Won Deals / Demos Completed × 100. The B2B SaaS benchmark sits around 20%. Below 12% signals systemic demo quality issues. Track Demo ROI per Rep to identify who needs coaching. Owner: Manager.
17. Sales Cycle Length
Days from first demo to closed-won. Your Demo Velocity Rate is the real speedometer here. One team I worked with dropped from 14 to 9 days after automating follow-ups. Owner: RevOps.
18. Revenue Influenced
Total ARR from deals that included at least one demo. This connects demo activity to the number that matters. Owner: RevOps/Founder.
19. Follow-up SLA Compliance
Formula: Follow-ups Sent Within SLA / Total Demos × 100. Time-to-First-Action must be under 15 minutes. Follow-Up Latency beyond 30 minutes correlates with a 40% drop in conversion. Set a 15-min SLA in team chat with auto-alerts. Owner: AE/Manager.
20. Response Time
Average minutes from demo end to first outbound touch. This is different from SLA compliance—it’s the raw speed metric. Track it daily. Owner: AE.
The KPI Priority Pyramid™
Not all 20 KPIs carry equal weight. Here’s the hierarchy:
Demo-to-Close, Revenue Influenced
Demo-to-Opportunity, Proposal Rate
Engagement Score, Sales Cycle
Attendance, Duration, Stakeholders
Booking Rate, Time-to-Schedule
Qualified Demo Rate, ICP Match
Volume, Growth, Source Quality
The pyramid works bottom-up. You can’t fix Demo-to-Close if your Attendance Rate is 60%. You can’t fix Attendance if your qualification is broken. Optimizing foundational KPIs is what drives top-line growth.
KPI Ownership Matrix
Every demo KPI should have a clearly defined owner and review cadence to ensure accountability and continuous improvement.
| KPI | SDR | AE | Manager | RevOps | Founder |
|---|---|---|---|---|---|
| Demo Request Volume | ● | ○ | |||
| Qualified Demo Rate | ● | ○ | |||
| Booking Rate | ● | ○ | |||
| Attendance Rate | ● | ○ | |||
| Engagement Score | ● | ○ | |||
| Demo-to-Opportunity | ● | ● | ○ | ||
| Demo-to-Close | ● | ● | ○ | ||
| Follow-up SLA | ● | ● | |||
| Revenue Influenced | ● | ● | |||
| Sales Cycle Length | ○ | ● |
● = Primary Owner | ○ = Secondary/Reviewer
KPI Review Cadence
Daily
Response Time, Follow-up SLA Compliance, Ghost Rate. These are operational pulse checks—your Demo Accountability Score depends on them.
Weekly
Attendance Rate, Booking Rate, Demo Request Volume, Engagement Score. Weekly standups should surface Demo Funnel Drop-off patterns.
Monthly
Demo-to-Opportunity, Qualified Demo Rate, Source Quality, Calendar Utilization, Stakeholder Participation.
Quarterly
Demo-to-Close, Revenue Influenced, Sales Cycle Length, Demo ROI per Rep, Demo Request Growth Rate.
Demo KPI Scorecard
Score your demo operation out of 100:
| Dimension | Weight | Score (1–10) | Weighted |
|---|---|---|---|
| Attendance Rate | 20% | ___ | ___ |
| Lead Quality / ICP Match | 15% | ___ | ___ |
| Engagement Score | 15% | ___ | ___ |
| Demo-to-Opportunity | 20% | ___ | ___ |
| Follow-up SLA | 15% | ___ | ___ |
| Response Time | 15% | ___ | ___ |
| Total | 100% | /100 |
Below 60? Your demo process has structural problems. 60–80 means you’re functional but leaking revenue. Above 80, you’re operating at a high level.
Which KPIs Matter Most at Different Growth Stages?
Startup (Pre-$1M ARR)
Focus on Attendance Rate, Demo-to-Close, Response Time, and Demo Request Volume. You don’t need 20 KPIs. You need four that tell you if your demo process is working at all.
Scale-up ($1M–$10M ARR)
Add Qualified Demo Rate, Source Quality, Stakeholder Participation, Follow-up SLA, and Sales Cycle Length. This is where funnel leakage becomes expensive.
Enterprise ($10M+ ARR)
Full framework. Revenue Influenced, Demo ROI per Rep, Calendar Utilization, and Engagement Score become critical for resource allocation.
Common KPI Mistakes
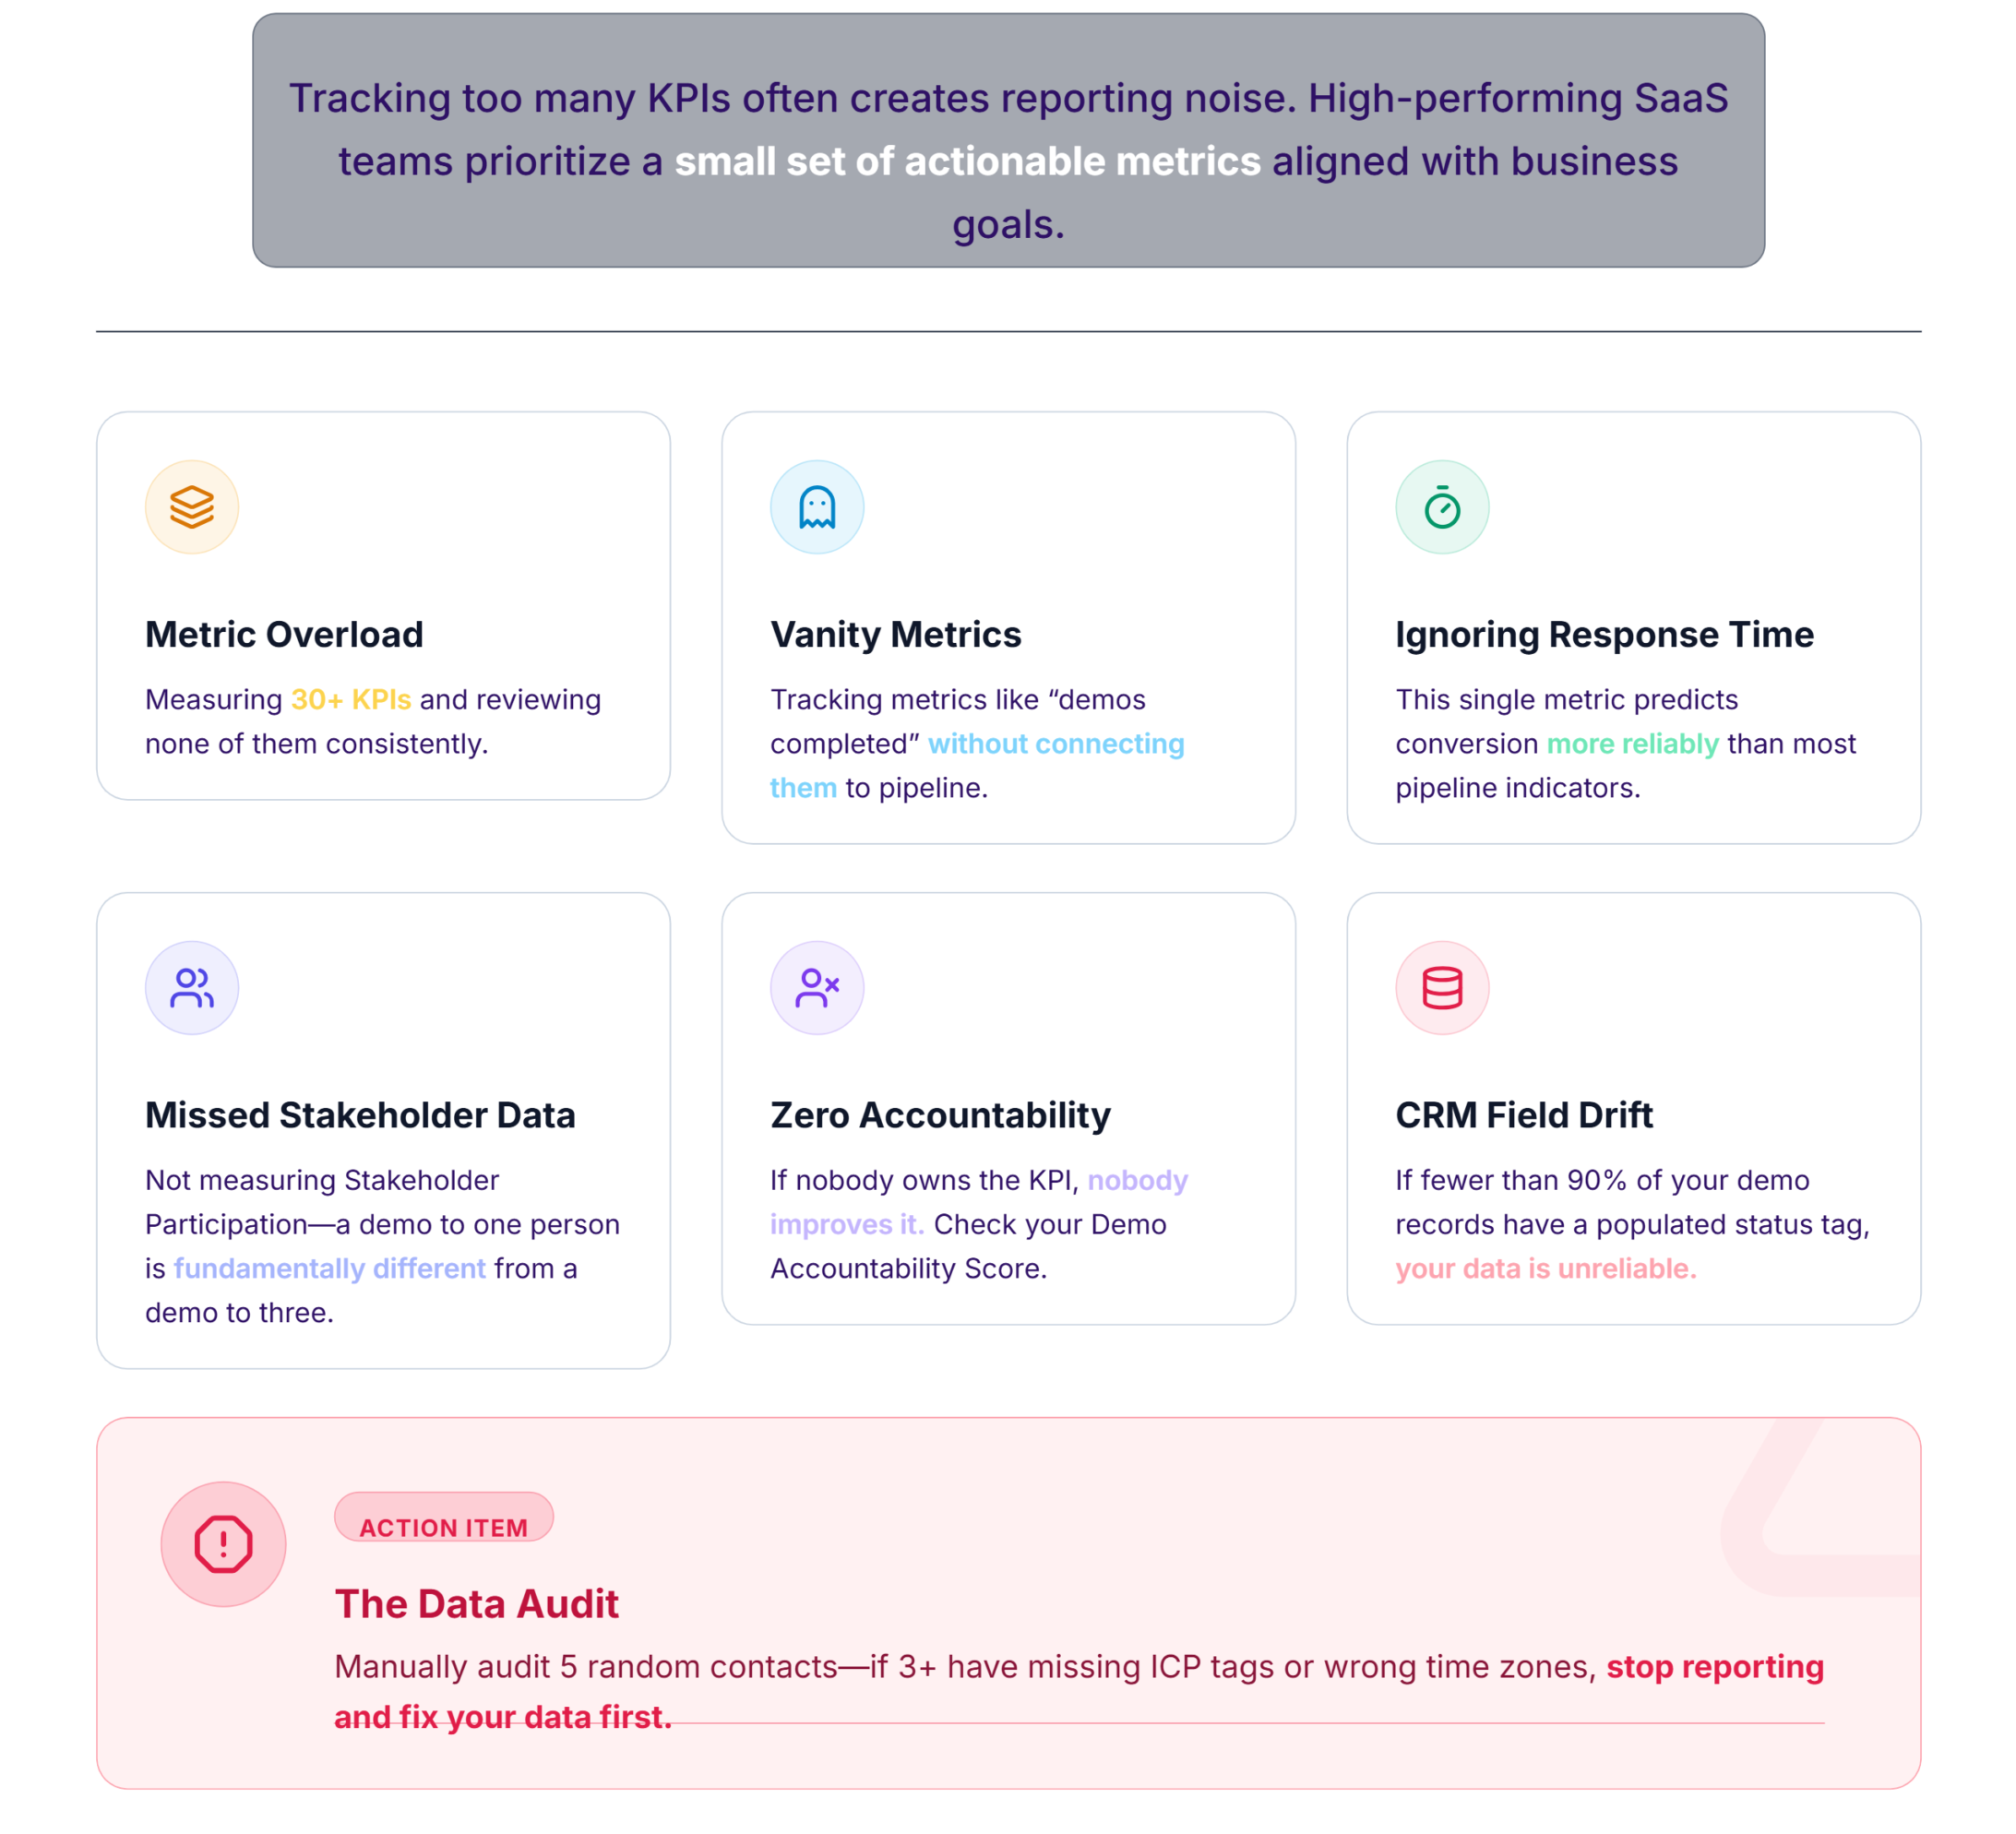
Tracking too many KPIs often creates reporting noise. High-performing SaaS teams prioritize a small set of actionable metrics aligned with business goals. Here’s what I see go wrong:
- Measuring 30+ KPIs and reviewing none of them consistently.
- Tracking vanity metrics like “demos completed” without connecting them to pipeline.
- Ignoring Response Time entirely—this single metric predicts conversion more reliably than most pipeline indicators.
- Not measuring Stakeholder Participation—a demo to one person is fundamentally different from a demo to three.
- Zero accountability. If nobody owns the KPI, nobody improves it. Check your Demo Accountability Score.
- CRM field drift. If fewer than 90% of your demo records have a populated status tag, your data is unreliable. Manually audit 5 random contacts—if 3+ have missing ICP tags or wrong time zones, stop reporting and fix your data first.
The “Ugly Truth” Table
| Problem | Root Cause | The Fix |
|---|---|---|
| Ghost Rate > 15% | No pre-demo qualification | Add a 2-min intent check call before booking |
| Follow-Up Latency > 30 min | Manual email workflows | Use Slack-to-CRM bots for auto-triggered follow-ups |
| Demo-to-Opportunity < 30% | Poor ICP match upstream | Run a 3-point ICP Score; only book if score ≥ 7 |
| CRM drop-off at “No Response” | Single-channel follow-up | Switch to SMS + Email + LinkedIn; 3x response rate |
| Time-to-First-Action > 1 hr | No SLA enforcement | Set 15-min SLA with auto-alerts in team chat |
Track Every Demo KPI in One Dashboard
If you’ve been stitching together spreadsheets and CRM reports to track demo performance, LevelUp Demo gives you a single view—from request to outcome—with built-in follow-up management, scheduling, and demo analytics. It’s built for exactly the kind of operational visibility this guide describes.
Frequently Asked Questions
What are demo operations KPIs?
Demo operations KPIs are measurable indicators that help SaaS teams evaluate the efficiency and effectiveness of their demo process, from demo requests and qualification to attendance, conversion rates, and revenue generated. They isolate the demo as a distinct revenue event within the broader sales funnel.
Which demo KPIs are most important?
Demo-to-Close Rate, Attendance Rate, Follow-up SLA Compliance, and Revenue Influenced are the four highest-impact metrics. Start with these before expanding your tracking. The KPI Priority Pyramid™ provides the full hierarchy.
How many KPIs should SaaS teams track?
Start with 4–6 at the startup stage and expand to 15–20 as your team scales. Tracking more than you can consistently review creates noise without improving performance. Match your KPI count to your review capacity.
What is a good demo attendance rate?
A healthy demo attendance rate is 80–85%. Below 75% indicates pre-qualification or scheduling friction. Teams without pre-demo intent checks average a Ghost Rate of 18%, meaning nearly one in five booked demos goes unattended.
How often should demo KPIs be reviewed?
Response Time and Follow-up SLA should be checked daily. Attendance and Booking Rate weekly. Conversion metrics monthly. Revenue Influenced and Demo-to-Close quarterly. Match cadence to the KPI’s volatility and actionability.
Who should own demo KPI reporting?
RevOps should own the reporting infrastructure and data integrity. Individual KPIs should be owned by the role closest to the action—SDRs own Booking Rate, AEs own Attendance and Follow-up, Managers own conversion metrics, and Founders review Revenue Influenced quarterly.
The Bottom Line
The teams that win at demos aren’t running more of them. They’re measuring the ones they run with enough precision to know exactly where to intervene. Pick your four starting KPIs today, assign an owner to each, and review them next Monday. That’s the whole game.