
A common capacity-planning mistake starts with a reasonable-sounding question: “How many demos did we run last month?” The number comes back. 200. Leadership looks at the calendar, sees open slots, and concludes there’s room for 50 more.
Then follow-up completion drops. Preparation gets rushed. CRM records go stale. Reps start booking demos back-to-back without recovery time, and conversion rates quietly erode. The calendar said there was room. The workflow disagreed.
That gap between calendar availability and actual operational capacity is what this article is about. By the end, you’ll have a working model to calculate how much demo workload your team can absorb, where the real constraint lives, and whether the answer is more people, better process, or both.
- Demo capacity is workload capacity, not calendar capacity.
- Calculate load across preparation, delivery, follow-up, and overhead.
- Compare required workload against available team hours.
- Find the bottleneck before adding headcount.
- Model future demand before it creates strain.
What is sales demo capacity planning?
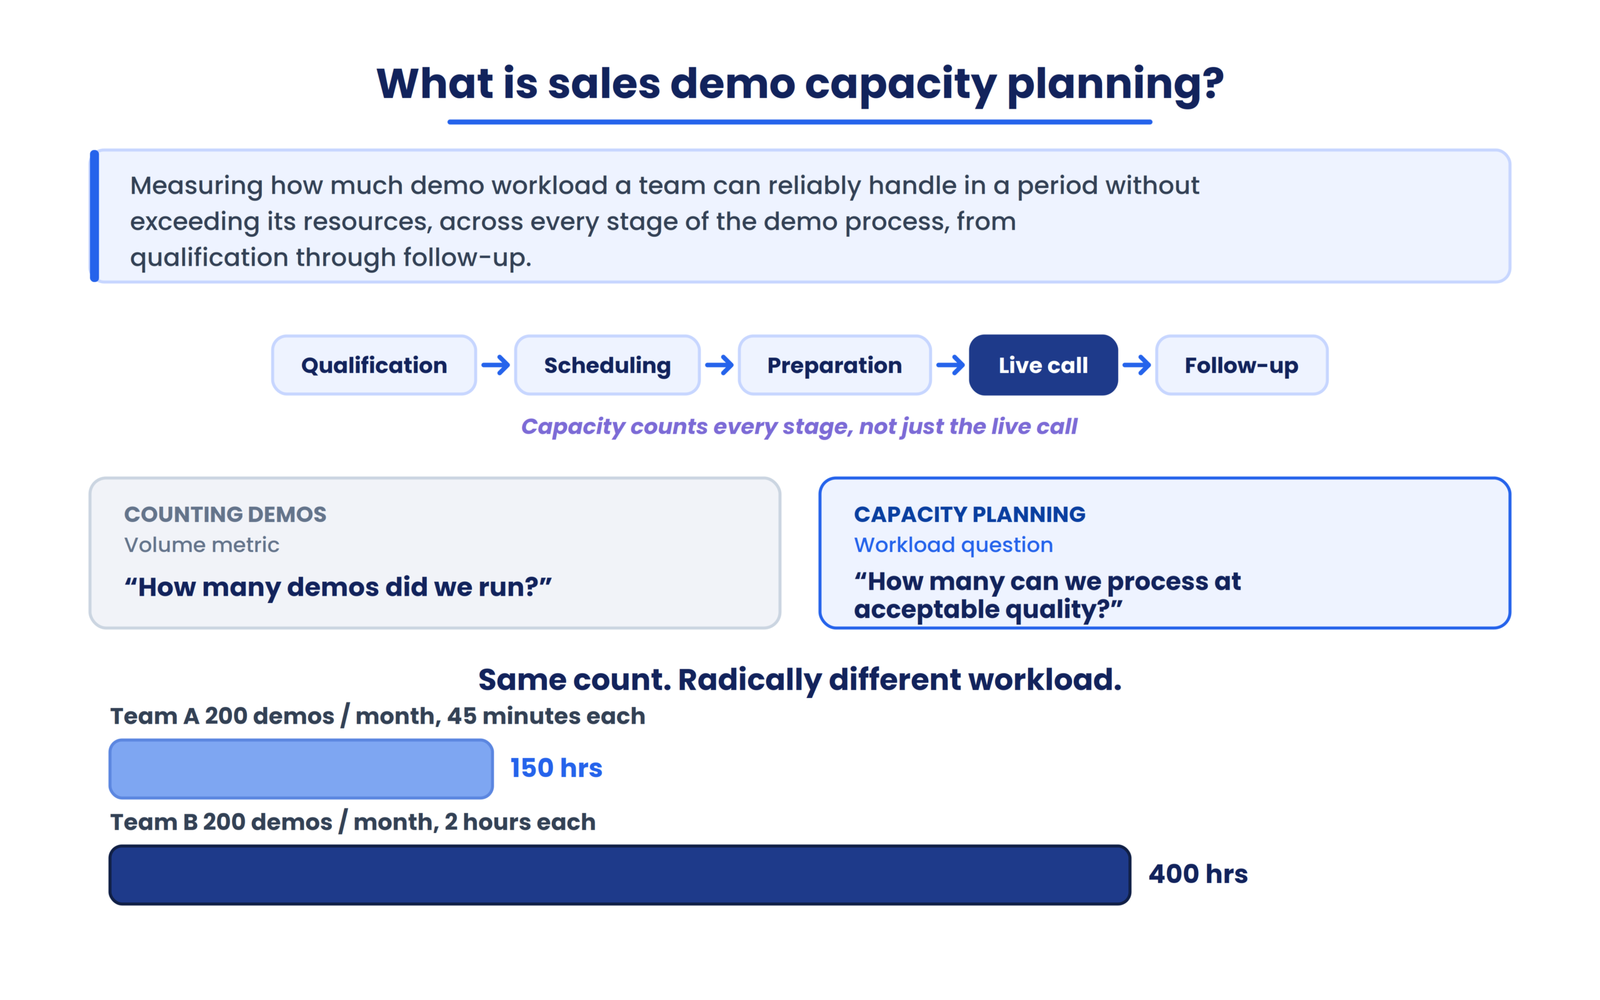
Sales demo capacity planning is the process of measuring how much demo-related workload a team can reliably handle during a given period without exceeding its available resources. It accounts for every stage of the demo process, from qualification through follow-up, not just the live call itself.
Most teams track demo count. That’s a volume metric. Capacity planning asks a different question: given the total work each demo creates, how many can the team process at an acceptable quality level?
The distinction matters because a team running 200 demos a month where each demo requires 45 minutes of total effort is in a fundamentally different position than a team running 200 demos where each one requires two hours. Same count. Radically different workload.
Why demo count is a poor measure of capacity
Two hypothetical teams illustrate the problem.
Team A runs 100 SMB demos per month. Each demo involves minimal prep, a 30-minute call, a templated follow-up email, and a quick CRM update. Total work per demo: roughly 45 minutes.
Team B runs 100 mid-market demos per month. Each one requires account research, a customized environment, a 45-minute call with multiple stakeholders, a detailed recap, and internal coordination with a solutions consultant. Total work per demo: around 120 minutes.
Both teams “did 100 demos.” Team A used about 75 hours of capacity. Team B used 200 hours. Judging them by the same number is operationally meaningless.
ACV tiering compounds this. Benchmark data from quota-modeling sources suggests demo-to-close rates of roughly 20–25% in SMB, 14–20% in mid-market, and 8–12% in enterprise segments. Enterprise demos convert at lower rates but carry higher revenue, so they demand more preparation and follow-up per unit. Blending these into one “demos per rep” target obscures where strain actually appears.
The LevelUp Demo Capacity Model
For planning purposes, LevelUp’s model organizes demo capacity around seven stages:
→
Qualification
→
Scheduling
→
Preparation
→
Live Demo
→
Follow-Up
→
Operational Overhead
Each stage consumes time. Each stage can become a constraint. And the total time consumed across all stages for a single demo is what LevelUp calls demo load.
This is a LevelUp framework, not an established industry standard. But it reflects how demo work actually accumulates when you watch the process end to end rather than measuring only the calendar event.
What counts as demo load?
| Component | What it includes |
|---|---|
| Preparation | Account research, customization, environment setup |
| Live demo | The actual demo session |
| Follow-up | Recap, next steps, CRM updates, internal notes |
| Operational overhead | Routing, scheduling coordination, rescheduling, admin |
8 inputs you need to calculate demo capacity
These are the core variables:
1
Monthly demo requests
2
Qualification rate (what percentage actually become held demos)
3
Demo show rate
4
Average demo duration
5
Average preparation time per demo
6
Average follow-up time per demo
7
Operational overhead per demo
8
Available team hours per month
For teams with more complexity, add these:
- Percentage of demos requiring SE involvement
- Percentage requiring customized environments
- Multi-stakeholder demo rate
- Reschedule and no-show rate
- POC or technical evaluation rate
Benchmark data places common no-show rates at 20–50% depending on motion and segment, with median show rates around 55–65% for many B2B SaaS teams according to recent benchmark reporting. That gap between booked and held demos is itself a capacity consideration. Your team still spends time preparing for demos that don’t happen.
How to calculate your team’s demo capacity
The formula is straightforward once you have the inputs.
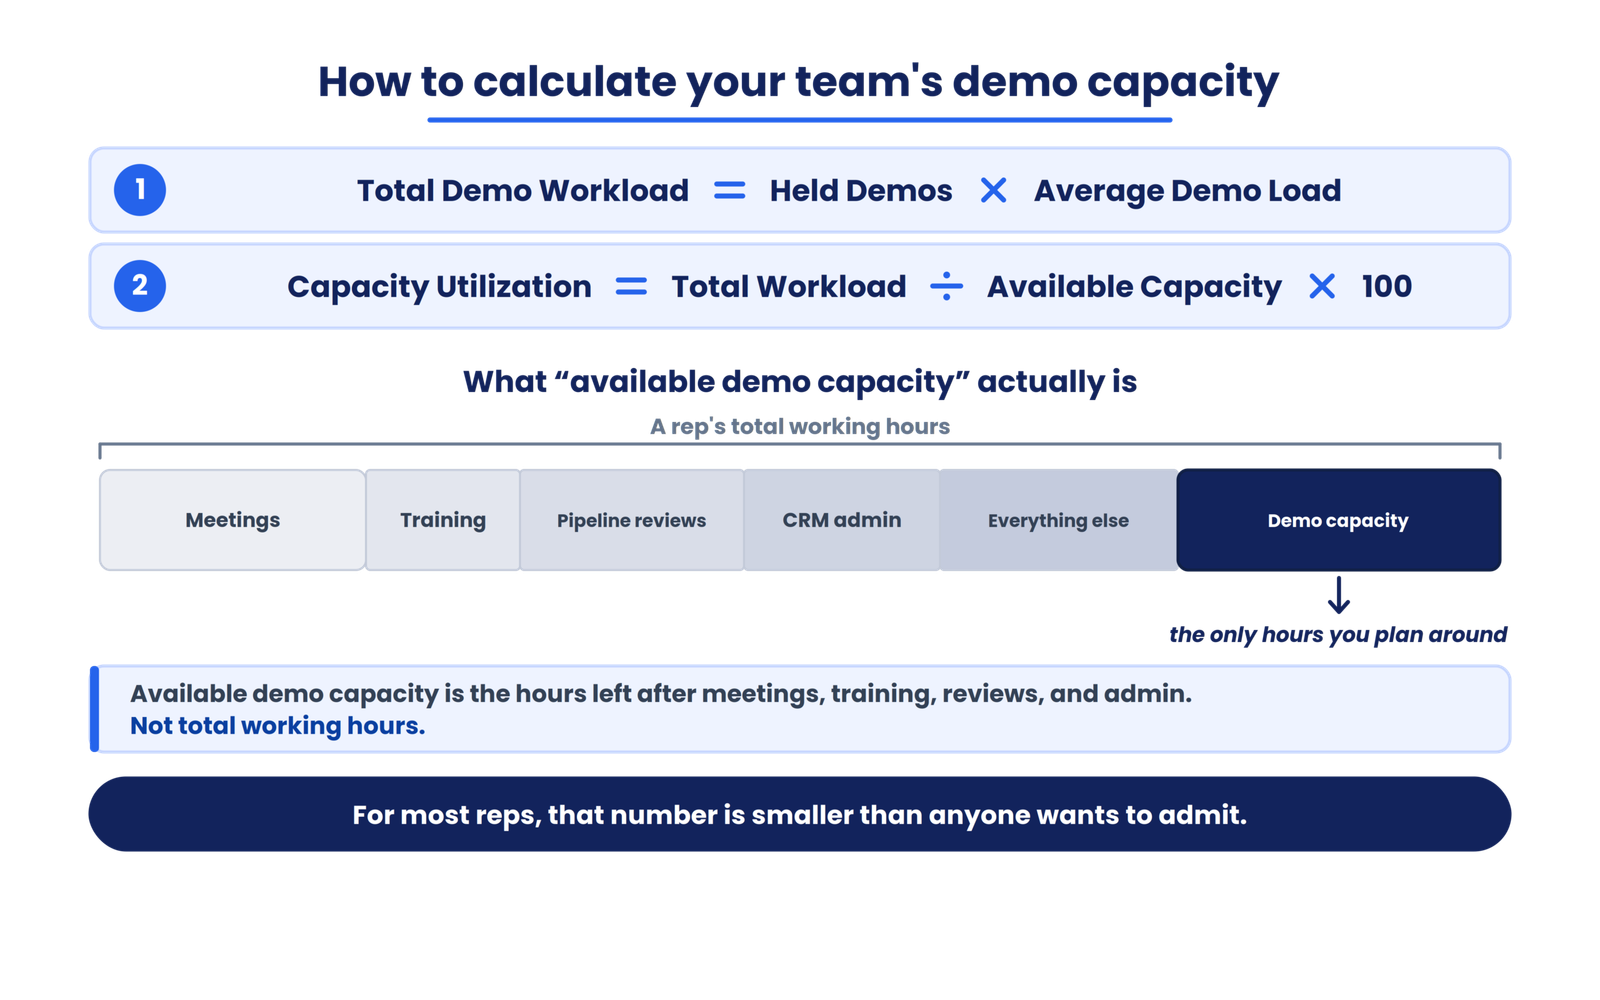
Available Demo Capacity is the number of hours your demo-carrying team members can actually spend on demo-related work. Not their total working hours. The hours remaining after internal meetings, training, pipeline reviews, CRM administration, and everything else that fills a calendar.
For most reps, that number is smaller than anyone wants to admit.
Worked example (hypothetical SaaS team)
Assumptions:
- 200 held demos per month
- 45-minute average live demo
- 30-minute average preparation
- 20-minute average follow-up
- 10-minute operational overhead per demo
If the team has 4 AEs each with roughly 100 available demo hours per month (after all non-demo work), total available capacity is 400 hours.
Capacity vs. utilization vs. throughput vs. demand
These four terms describe different things, and conflating them causes planning errors.
Demand is how many demos the market is requesting.
Throughput is how many demos the team actually completes in a period.
Capacity is the maximum workload the team can absorb at acceptable quality.
Utilization is the percentage of available capacity currently being consumed.
A team can have high throughput and high utilization while demand keeps climbing. That’s the moment before things break. Utilization over 85–90% in practice leaves almost no buffer for reschedules, complex deals, or unexpected spikes.
Finding the real demo capacity bottleneck
A team’s overall capacity is constrained by whichever stage has the least available capacity relative to its demand. LevelUp calls this the Demo Capacity Bottleneck Model.
The chain looks like this:
→
Qualification
→
Routing
→
Scheduling
→
AE Delivery
→
SE Support
→
Follow-Up
A team may have four AEs with open calendars but only one SE. If 40% of demos require technical SE involvement, SE availability becomes the constraint. Adding a fifth AE changes nothing.
| Bottleneck stage | Symptom | What it looks like in practice |
|---|---|---|
| Qualification | Leads wait days for response | SDR capacity or routing rules are the constraint |
| Scheduling | Long booking lag, high no-shows | Calendar density is too high or lead time is too long |
| SE availability | AEs delay technical demos | SE capacity is the actual ceiling |
| Follow-up | Next steps go missing after the call | Rep-level workload exceeds available admin time |
Source segmentation matters here too. Outbound-booked demos tend to be more fragile than inbound, with materially worse show rates in many benchmark sets. A team that treats all demo sources identically in its capacity model will misallocate resources.
How SDR, AE, and SE capacity interact
SDRs generate qualified conversations. AEs run demos and own deals. SEs provide technical depth. RevOps keeps the plumbing working.
Each function has its own capacity ceiling. The system’s throughput is limited by whichever ceiling is lowest relative to its share of the workload. Capacity-oriented commentary in the field suggests many reps top out around 15–20 demos per week, or 50–60 qualified conversations per month, before execution quality erodes. But that range shifts dramatically based on deal complexity, ACV tier, and how much SE support each demo needs.
There is no universal “one SE per X AEs” ratio. The ratio depends on what percentage of demos require SE participation, how long SE-involved demos take, and how much preparation the SE does independently. Calculate it from your own demo load data.
Signs your demo team is near capacity
Five stop/go checks, pulled from operational patterns that surface repeatedly:
1
Check five random booked demos in your CRM. If three lack an owner or documented next step, the process is already strained.
2
Compare booked versus held demos for the last month. A large gap means no-shows are consuming prep time without producing pipeline.
3
Review rep calendars. If demos are packed without recovery time between calls, preparation and follow-up are being sacrificed.
4
Audit five completed demos. If follow-up tasks weren’t created the same day, the handoff failed.
5
Ask reps how much time they spend on demo-adjacent admin work. The answer is usually higher than leadership expects.
What to do when demo demand exceeds capacity
That looks manageable until demand shifts.
At +25%, the team is already over capacity. Something gives: preparation quality, follow-up speed, or conversion rate. Follow-up speed is where the damage shows first. Harvard Business Review’s lead-response research found that firms responding to an inquiry within an hour were nearly seven times more likely to qualify the lead as those that waited 24 hours. Overloaded calendars push follow-up in the wrong direction, not the right one.
When to hire vs. when to fix the workflow
| Consider hiring when… | Consider process changes when… |
|---|---|
| Workload genuinely exceeds available human hours | Repetitive tasks consume significant time |
| The work requires human judgment and relationship | Routing or scheduling is manual |
| Demand is sustained, not a temporary spike | Preparation is duplicated across reps |
| Automation cannot remove the constraint | Follow-up is inconsistent or delayed |
Consider self-service or interactive demo experiences when the use case doesn’t require live human interaction and buyers can evaluate independently. Consider workflow automation when the bottleneck is coordination rather than selling. Ramp time matters too: HubSpot reports a 3.2-month average ramp time for new sales hires, so headcount doesn’t produce immediate capacity relief.
Planning for 25%, 50%, and 100% more demo demand
| Scenario | Demo demand | Total workload | Utilization | Operational question |
|---|---|---|---|---|
| Current | 200/month | 350 hrs | 87.5% | Can the team sustain this quality? |
| Growth (+25%) | 250/month | 437.5 hrs | 109% | Where does strain first appear? |
| Expansion (+50%) | 300/month | 525 hrs | 131% | Which function becomes the constraint? |
| Surge (+100%) | 400/month | 700 hrs | 175% | Can process changes absorb this? |
How automation can increase demo capacity
Automation doesn’t replace the demo. It compresses the operational overhead around the demo: routing, scheduling, reminders, CRM updates, follow-up task creation, outcome logging.
If a team’s operational overhead per demo is 10 minutes and automation reduces that to 3 minutes, that’s 7 minutes recovered per demo. At 200 demos per month, that’s roughly 23 hours returned to the team. Not transformational on its own, but it compounds with improvements to preparation templates, scheduling workflows, and follow-up automation.
If your team is spending significant time on demo coordination, routing, and follow-up logistics rather than actual selling, a demo workflow management layer can reduce that overhead without adding headcount.
SaaS demo capacity planning checklist
Define demo load for your team (prep + delivery + follow-up + overhead)
Measure booked, held, and no-show demos separately
Segment by source, ACV tier, and SE involvement
Calculate total monthly demo workload in hours
Calculate available demo capacity per team member
Identify the bottleneck stage in your demo process
Model +25% and +50% demand scenarios
Decide whether the constraint is people, process, or tooling
For a broader operating model around demo operations, the LevelUp Demo Operations Playbook covers workflow architecture and measurement beyond capacity planning.
Frequently asked questions
How many demos can a sales engineer handle per week?
There is no universal number because demo load varies by preparation requirements, product complexity, customization, stakeholder count, and follow-up obligations. A sales engineer handling standardized 30-minute SMB demos operates in a different universe than one running 90-minute enterprise technical evaluations. Calculate your SE’s available demo hours, divide by average demo load per session, and that gives you a defensible number for your specific context.
What is a good demo show rate?
Recent benchmark data places median B2B SaaS show rates around 55–65%, meaning 35–45% of booked demos don’t happen. Show rates improve when teams shorten the gap between booking and the actual meeting and use multi-touch confirmation sequences.
How do you know if your demo team is overloaded?
Look at lagging indicators: declining follow-up completion rates, increasing time-to-first-response on demo requests, rising no-show rates, and falling demo-to-opportunity conversion. If reps are consistently missing the 24-hour follow-up window, calendar density has likely exceeded practical capacity.
Should I hire another rep or fix my demo workflow first?
Audit where time actually goes. If reps spend substantial hours on coordination, scheduling, and CRM updates rather than preparation and selling, workflow improvements may recover enough capacity to delay a hire. If the constraint is genuinely not enough humans to run the demos, process changes won’t close the gap.
Conclusion
The next problem most teams hit after calculating capacity is figuring out which demo operations KPIs actually predict when quality is about to degrade, before conversion rates confirm it. That’s a measurement question, not a capacity question, and it deserves its own framework.
MORE DEMOS, SAME TEAM
See how LevelUp Demo helps teams absorb more demand without adding headcount, by managing the workflow around every demo, from routing and scheduling through follow-up and outcome logging.