Last quarter, we audited a 12-person SaaS company that was running 40+ demos a month. Their calendar was packed. Their SDRs were busy. Their founder told us, “We’re doing everything right — demos are happening.”
Then we looked at what happened between demo booked and deal closed, and found a 40% drop-off zone that nobody was measuring. They weren’t losing to competitors. They were losing to their own invisible funnel.
That gap — the one between a demo request landing in your inbox and revenue actually hitting your account — is the SaaS demo funnel most teams don’t track. And it’s quietly dragging pipeline velocity into the ground.
By the end of this post, you’ll know exactly where your demo funnel is leaking, which stages you’re probably not measuring at all, and what to fix first to recover lost revenue.
Before You Read: The Readiness Check
This post isn’t about top-of-funnel lead gen. It’s not about getting more demo requests. It’s about what happens to the ones you already have.
To get value from this, you need two things locked down:
- You’re running demos regularly (even 5-10/month counts)
- You have some CRM or tracking tool — HubSpot, Salesforce, even a spreadsheet
Stop/Go test: Can you tell me, right now, what percentage of your qualified demo requests actually convert to a booked meeting within 48 hours?
If you hesitated, keep reading. That hesitation is the problem.
The Funnel You Think You Have vs. The One That’s Actually Running
Most SaaS teams track two things: demo requests in, and deals closed. Maybe they track meetings booked. Maybe.
Here’s what that looks like in their heads:
Demo Request → Demo Happens → Deal Closes (or doesn’t)
Clean. Simple. Wrong.
The real funnel has at least four stages between request and revenue — and most teams are blind to at least two of them:
- Demo form submission — someone fills out your form
- Form fill to qualified — does this person actually match your ICP?
- Qualified-to-meeting conversion — do they actually book and show up?
- Post-demo action — was there a mutual action plan, a follow-up, or just… silence?
That middle layer — stages 2 and 3 — is where 30-50% of potential pipeline evaporates.
And it barely shows up in most dashboards.
Phase 1: The Qualification Blind Spot
Here’s a number that should bother you: the average form fill to qualified rate in B2B SaaS hovers around 40% for most teams.
Elite performers hit 60-70%. Some verticals like Real Estate push 90%.
The gap? ICP fit scoring.
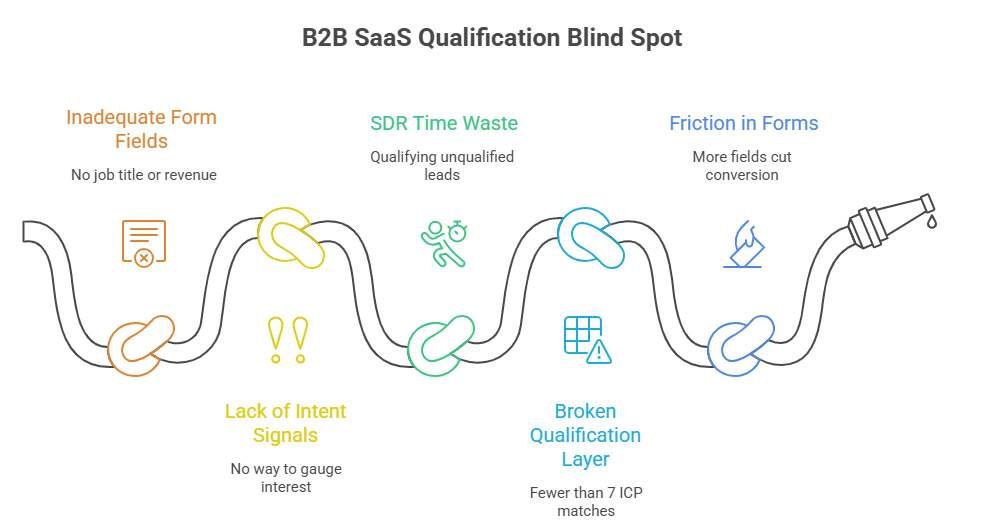
Most demo forms ask for name, email, company. Maybe company size. That’s it. No job title filter. No revenue band.
No intent signal. So what happens is your SDR team spends hours qualifying leads that should’ve been filtered before they ever hit the queue.
What you should see: Your CRM showing green “Qualified” badges on 70%+ of demo requests.
If you’re seeing less than that, your form is the bottleneck — not your sales team.
The verification: Pull your last 10 demo form submissions.
How many had clear ICP match — right title, right company size, right use case?
If it’s fewer than 7, your qualification layer is broken.
Here’s the part that stings. Even when the product is genuinely good, a weak qualification process means your best reps are burning time on prospects who were never going to buy.
Product quality doesn’t fix process gaps.
Friction warning: Forms with more than 5 fields cut conversion rates by 35-45%.
But stripping fields without adding smart qualification (UTM tracking, live chat handoffs, conditional logic) just trades one problem for another.
You get more submissions, but junkier ones.
📉 The 5-Minute Warning
Recent B2B data for 2025 confirms that the “Speed to Lead” window is shrinking. If you don’t engage a qualified lead within 5 minutes of form submission (via automated booking or email), your chance of booking a demo drops by 80%. If your “Qualified-to-Meeting” rate is low, latency is likely the culprit.
Phase 2: The Scheduling Black Hole
This is the stage I see teams ignore the most. And honestly, it’s the one that costs the most revenue.
A lead qualifies. Great. Now what?
In most small SaaS teams, the answer is: someone sends an email. Maybe two. Then waits.
Then follows up three days later. By then, the prospect’s booked a demo with your competitor who had a Calendly link embedded in their confirmation email.
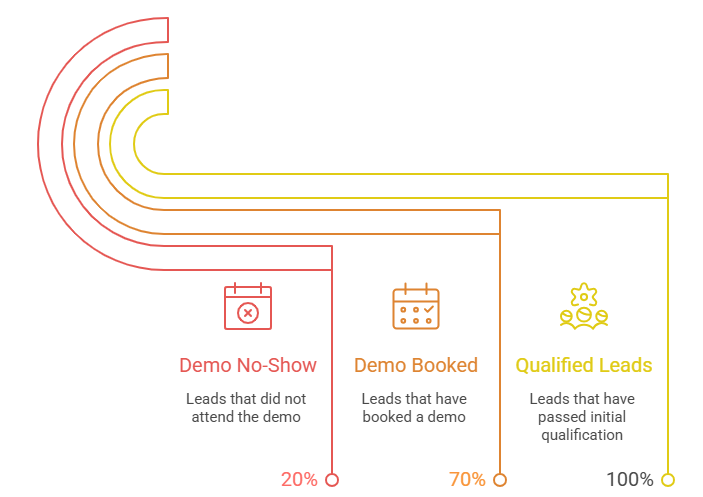
The qualified-to-meeting conversion rate across B2B SaaS sits at 50-60% typically.
Teams that embed instant booking links and automate confirmations hit 70%+. The difference?
Booking efficiency — and specifically, eliminating the email ping-pong that kills momentum.
What you should see: Orange “Booked” icons in your CRM with timestamps under 24 hours from qualification.
If your average time-to-book is 48+ hours, you’ve got engagement friction eating your pipeline.
The verification: Check your last 20 qualified leads. How many booked within 48 hours?
If it’s below 70%, you have a scheduling problem, not a demand problem.
And then there’s the no-show rate. Demo no-show rates run 20-50% without automation.
That’s not a rounding error — that’s half your calendar going dark.
One fix we’ve seen work repeatedly: automated SMS reminders via Zapier, triggered 2 hours before the demo. Simple. Unsexy.
Cuts no-shows dramatically.
If you’re struggling with converting demos into actual deals, start here.
The drop-off isn’t always in the demo itself — it’s in the 24-72 hours before it.
Phase 3: The Post-Demo Void
A demo happens. It goes well. The prospect says “this looks great, let us discuss internally.”
Then… nothing.
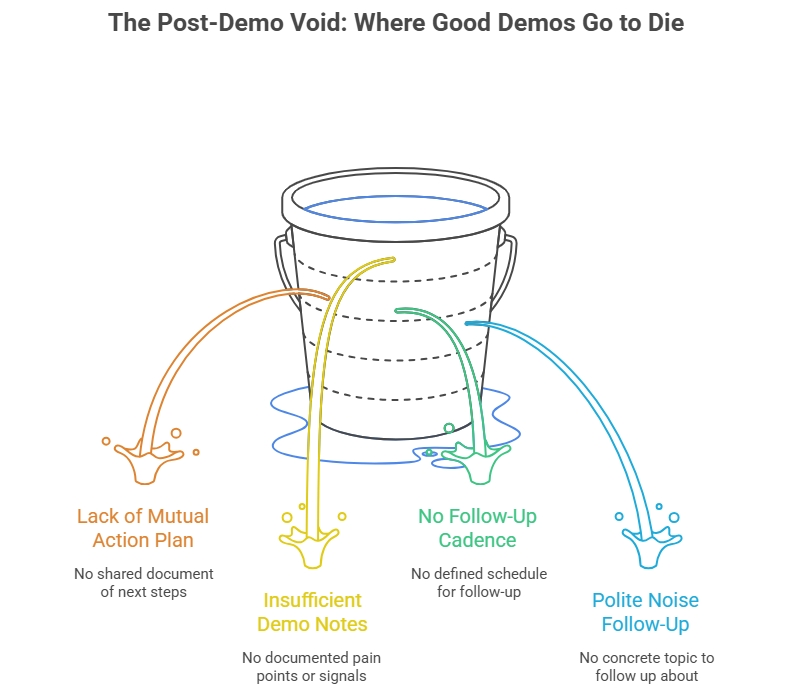
No mutual action plan. No defined next step. No follow-up cadence.
Just a CRM status that says “In Progress” for three weeks until someone marks it “Lost — No Response.”
This is the funnel stage that makes me uncomfortable, because it’s the one where good demos die.
SQL to opportunity conversion should sit at 42-62%. But when demos end without a MAP — a clear, shared document of what happens next, who does what, and by when — that number tanks.
What you should see: Demo notes in your CRM with documented pain points, commitment signals, and a next-step timeline.
If your notes just say “went well, will follow up,” that’s not tracking — that’s hoping.
The verification: Spot-check your last 5 closed-lost deals. How many had a mutual action plan documented after the demo?
If fewer than 3 did, your post-demo process is where revenue goes to die.
The follow-up problem isn’t just about sending emails. It’s about having something concrete to follow up about.
Without a MAP, your follow-up is just polite noise.
💡 MAPs Move Mountains
Did you know? Deals that utilize a **Mutual Action Plan (MAP)** post-demo are **60% more likely to close** than those that don’t. Why? Because a MAP shifts the dynamic from “salesperson chasing prospect” to “partners executing a project plan.” It turns ambiguity into accountability.
The Ugly Truth: Ghost Errors That Don’t Show Up in Dashboards
These are the problems that don’t trigger alerts. They just quietly erode your numbers month after month.
| Problem | The Weird Fix | Why It Works |
|---|---|---|
| 50% of qualified leads ghost after demo | Mandate “pain + commitment” close questions in every demo; auto-text unconfirmed slots | Forces real qualification during the demo, not just before |
| Demo forms generate junk leads despite high volume | Hyper-personalize via UTM parameters + live chat handoff instead of static forms | 35% lift in qualified submissions by matching intent to experience |
| SDRs spend 40% of time chasing no-shows | Embed Calendly + Zapier SMS confirmations 2 hours pre-demo | Reduces no-shows below 20% without adding headcount |
| MQL-to-SQL stalls at 26% from paid channels | Pre-qualify on job title + company size on the demo page itself | Filters out tire-kickers before they consume SDR bandwidth |
| Pipeline looks full but nothing closes | Enforce MAPs as a required CRM field post-demo | Turns vague “interest” into measurable deal progression |
The pattern here is consistent: teams are measuring activity (demos booked, forms filled) instead of quality transitions (qualified-to-booked, demoed-to-committed).
Your pipeline architecture should reflect these micro-stages, not just the big milestones.
Where This Connects to Revenue Operations
When your demo funnel has untracked stages, it doesn’t just cost you individual deals. It wrecks your forecasting.
Think about it. If you don’t know your real qualified-to-meeting conversion rate, your pipeline projections are fiction.
If you can’t distinguish between “demo completed” and “demo completed with a MAP and next step,” your close-rate data is polluted.
I was looking at the data recently and it’s wild that B2B SaaS top-line conversion averages just 1-3% visitor-to-lead, with a 2.9% industry average.
The funnel is already narrow. You can’t afford to lose 40% of what survives to scheduling friction and post-demo silence.
The teams that get this right aren’t doing anything exotic.
They’re just tracking the boring middle — the stages between “interested” and “closed” — with the same rigor they apply to top-of-funnel metrics.
Close the Gaps You Can’t See
Your demo funnel has gaps you can’t see in a spreadsheet. If you’re running demos but not tracking qualification rates, booking velocity, or post-demo actions in one place, LevelUp Demo connects your demo form, lead qualification, scheduling, and outcome tracking in a single lightweight dashboard — so the invisible middle of your funnel becomes visible.
FAQ: The Implementation Questions That Actually Matter
How do I fix a 50% qualified-to-meeting drop-off?
Embed one-click scheduling directly in your qualification confirmation flow. Add automated 24-hour reminders. Teams that do both consistently hit 70%+ qualified-to-meeting conversion. The fix isn’t more outreach — it’s less friction between “yes” and “booked.”
Why is my demo qualification rate stuck below 55%?
Your demo form likely isn’t filtering for ICP fit. Add conditional fields for job title, company size, or use case. Elite SaaS teams hit 60-70% qualification rates — some verticals push 90% — by gating forms with intent-based questions rather than generic fields.
How do I reduce demo no-shows below 20%?
Automate confirmation and reminder sequences. SMS reminders via Zapier 2 hours before the demo are the highest-impact single change. Pair that with calendar invites that include a clear agenda, and you’ll see no-show rates drop from the 30-50% range into manageable territory.
Why do demos feel busy but revenue stays flat?
Because demo volume isn’t the same as demo quality progression. If you’re not tracking form-to-qualified, qualified-to-booked, and booked-to-committed as separate metrics, you’re measuring motion, not momentum. The revenue bottleneck is almost always in the transitions, not the demos themselves.
How long does demo funnel optimization take to show results?
CRO sprints on demo pages and forms show measurable lifts in 2-3 weeks. Full funnel optimization — including qualification scoring, scheduling automation, and MAP enforcement — compounds over 3-6 months, typically delivering 20-30% conversion gains. Benchmarks stabilize after one full quarter of consistent tracking.
What’s the first metric I should start tracking?
Qualified-to-meeting conversion within 48 hours. It’s the single metric that reveals both qualification quality and scheduling efficiency simultaneously. If that number is below 60%, you’ve found your biggest leak.
The demo funnel most teams don’t track isn’t hidden because it’s complicated. It’s hidden because it sits in the boring space between marketing metrics and closed-won celebrations — the space where nobody’s looking but everyone’s losing.
Stop Guessing Where Your Demos Break Down
Get visibility into every stage from request to revenue. LevelUp Demo automates the tracking so you can focus on closing.
✅ Track Drop-Offs
✅ Measure Velocity
✅ Fix Leaks