I pulled our Q3 analytics last month and saw something that didn’t make sense.
Our sales team had run 47 demos. The feedback was overwhelmingly positive—prospects loved the product, asked great questions, even mentioned budget availability.
But only 11 deals closed.
That’s a 23% demo-to-close rate. Not terrible by industry standards, but frustrating when you know the demos themselves went well.
The problem wasn’t the pitch. It wasn’t the product. It was the seven days of radio silence after each call while our founder juggled product roadmap meetings and our lone AE tried to remember who needed a follow-up email versus who was waiting on a custom quote.
Here’s what you’ll know by the end of this guide: exactly what demo-to-close rate you should be targeting, why yours might be lower than it should be, and—most importantly—the specific process breakdowns that kill conversions after the demo ends.
What Is Demo-to-Close Rate?
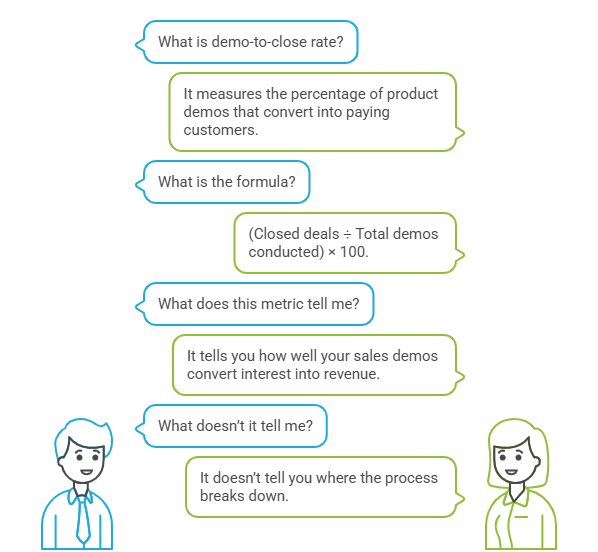
Demo-to-close rate measures the percentage of product demos that convert into paying customers.
Simple formula: (Closed deals ÷ Total demos conducted) × 100.
If you ran 40 demos last quarter and closed 10 deals, your demo-to-close rate is 25%.
This metric tells you how well your sales demos convert interest into revenue—but it doesn’t tell you where the process breaks down.
What Is a Good Demo-to-Close Rate for SaaS?
For B2B SaaS teams, a healthy demo-to-close rate sits between 20% and 30%.
Top-performing teams with strong qualification and tight follow-up processes hit 30% to 40%.
But context matters more than chasing a benchmark.
- Early-stage SaaS (pre-product-market fit, broad targeting):
- 15-20% is normal
- You’re still figuring out who your buyer is
- Lead quality varies wildly
- Growth-stage SaaS (defined ICP, inbound qualified leads):
- 25-35% is the target
- You know who converts and why
- Your demo process is repeatable
- Enterprise SaaS (long sales cycles, buying committees):
- 20-25% is solid
- Demos often happen early in a 6-month process
- The demo-to-SQL-to-close ratio matters more than demo-to-close alone
According to recent benchmarking data, SQL-to-close rates for B2B SaaS average 20-25%, with top performers reaching 30%+ through better qualification and personalization.
Product-led growth motions tend to see demo-to-close rates roughly 2x higher than traditional sales-led approaches when activation signals are strong.
📊 Benchmark Reality
While the average B2B SaaS demo-to-close rate hovers around 22%, companies that implement structured post-demo follow-up sequences see that number jump to 34%. The difference isn’t the product; it’s the persistence. What Is a Bad Demo-to-Close Rate?
Anything below 15% signals a process problem, not a sales skill problem.
Here’s what low conversion usually means:
Below 10%: You’re booking demos with unqualified leads. Your demo request form isn’t filtering out tire-kickers, or your marketing is attracting the wrong audience.
The issue starts before the demo even happens.
10-15%: Demos are going okay, but follow-up is inconsistent.
Prospects ghost because there’s no clear next step, or your team loses track of who needs what.
15-20%: You’re in the “average” zone, but there’s room to tighten qualification and improve post-demo execution.
The ugly truth: most teams with sub-15% rates don’t actually know their rate because they’re not tracking demo outcomes consistently.
They know how many demos they ran. They know how many deals closed.
But they can’t tell you which demos led to which deals, or why 60% of prospects went silent after a “great call.”
Why Do Demo-to-Close Rates Drop?
The demo itself is rarely the problem.
When we audit SaaS demo funnels, the conversion leak almost always happens in one of these four places:
1. Poor Lead Qualification
You’re letting anyone book a demo. Students researching for a project. Competitors doing recon.
Prospects three budget cycles away from a decision.
If your MQL-to-SQL conversion is below 20%, you’re wasting demo slots on leads that were never going to close.
Better qualification—using frameworks like MEDDPICC to score leads on Metrics, Economic Buyer, Decision Criteria, and other factors—can lift close rates into the 30%+ range.
2. No Clear Next Step Defined
The demo ends with “I’ll send you some information” or “Let me know if you have questions.”
No calendar invite for a follow-up call. No mutual action plan. No specific deliverable with a deadline.
Prospects don’t ghost because they’re rude. They ghost because you didn’t create a reason for them to re-engage.
3. Slow or Inconsistent Follow-Up
Industry data shows teams with structured post-demo follow-ups close significantly more deals than those winging it.
But “structured” doesn’t mean “more emails.” It means speed, relevance, and accountability.
If your AE takes three days to send the pricing doc, the prospect has already moved on.
If your founder forgets to follow up with the VP who requested a security review, that deal is dead.
⚡ The “Speed to Lead” Multiplier
Did you know? Leads are 9x more likely to convert when contacted within 5 minutes of an inquiry. Yet, nearly 50% of sales reps never make a second follow-up attempt. Speed + Persistence = Closed Won.
4. No Visibility Into What’s Actually Happening
Most small teams don’t know their demo-to-close rate because demo outcomes live in scattered places:
- “I think Sarah followed up with that lead”
- “Did we ever hear back from the guy who asked about integrations?”
- “I demoed someone last week but I can’t remember their company name”
You can’t improve what you can’t see. And if demo outcomes aren’t logged immediately after each call, you’re relying on memory instead of process.
How to Improve Your Demo-to-Close Rate
Improving demo-to-close rate isn’t about better slides or smoother talk tracks.
It’s about tightening the workflow before, during, and especially after the demo.
Phase 1: Filter Before the Demo
The Problem: Low-intent leads dilute your close rate and waste your team’s time.
The Fix: Add qualification friction to your demo request process.
Use high-intent form fields that force prospects to self-qualify. Instead of just “Name, Email, Company,” ask:
- What specific problem are you trying to solve?
- What’s your timeline for a decision?
- Who else is involved in the buying process?
These questions won’t scare off serious buyers. They’ll scare off people who were just browsing.
Our research shows that adding strategic qualification fields can dramatically improve the quality of demos on your calendar.
Visual Checkpoint: Your CRM should show each lead tagged with qualification scores (e.g., “High Intent,” “Timeline: Q1,” “Budget: Confirmed”).
If you’re manually sorting through generic “Request a Demo” submissions, your filter isn’t working.
Verification: Pull the last 10 demo requests. If fewer than 6 of them clearly state a business problem and timeline, your form needs work.
Phase 2: End Every Demo With a Commitment
The Problem: Demos end with vague “next steps” that never happen.
The Fix: Before the demo ends, create a mutual action plan with specific dates and owners.
Example close:
“Okay, so here’s what happens next. I’ll send you the pricing breakdown and the security documentation by end of day tomorrow. You’re going to review it with your CFO by Friday. Let’s book 20 minutes next Tuesday to discuss any questions. Does 2pm work?”
Then send a calendar invite during the call.
This isn’t high-pressure sales. It’s project management. You’re treating the deal like a shared responsibility, not a one-sided chase.
Visual Checkpoint: Your calendar should show follow-up calls booked for at least 60% of demos.
If your post-demo calendar is empty, you’re not creating commitment.
Verification: After your next 5 demos, check: did you book a follow-up meeting before hanging up?
If not, start doing it.
Phase 3: Log Outcomes Immediately
The Problem: Demo outcomes live in your head, not your system.
The Fix: Immediately after each demo, log the outcome in one central place.
Categories to track:
- Won: Deal closed
- Active: In follow-up, next step defined
- Stalled: No response after 2+ attempts
- Lost: Explicit “no” or went with competitor
- Unqualified: Shouldn’t have been on the calendar
Most teams skip this step because their CRM makes it tedious.
But if you don’t track outcomes, you can’t identify patterns.
You won’t know that 40% of your “stalled” deals are waiting on pricing approvals, or that prospects from a specific lead source never convert.
Visual Checkpoint: You should be able to open a dashboard and see: 12 demos this month, 4 won, 5 active, 2 stalled, 1 lost.
If you can’t produce that view in under 30 seconds, your tracking is broken.
Verification: Open your system right now. Can you name the outcome of every demo from the last two weeks?
If not, you need a better logging process.
Most Teams Lose Deals in the Follow-Up Gap
This is where tools like LevelUp Demo make a difference. It’s built specifically to capture demo outcomes, track follow-ups, and surface stalled deals—so small teams don’t lose revenue to disorganization. It works alongside your CRM, not as a replacement, and keeps demo workflow visible without adding complexity.
Phase 4: Review Outcomes Weekly
The Problem: You’re running demos but never analyzing what’s working.
The Fix: Block 30 minutes every Friday to review the week’s demo outcomes.
Ask:
- Which demos converted? What did they have in common?
- Which demos stalled? What was the last action taken?
- Are certain lead sources converting better than others?
- Is one team member closing at a higher rate? What are they doing differently?
This isn’t about blame. It’s about pattern recognition. Maybe demos with technical users close faster than demos with executives.
Maybe prospects who ask about integrations are more serious than those who ask about pricing first.
You won’t know unless you look.
Visual Checkpoint: You should have a simple spreadsheet or dashboard showing weekly trends: number of demos, close rate, average time-to-close, common objections.
Verification: If you can’t answer “Why did our demo-to-close rate drop from 28% to 19% last month?”
with specifics, you’re not reviewing outcomes systematically.
Phase 5: Tighten Follow-Up Speed
The Problem: Slow follow-ups kill momentum.
The Fix: Send the first follow-up within 2 hours of the demo ending.
This doesn’t mean a long recap email. It means a quick note that reinforces the next step:
“Hey [Name], great talking through [specific topic]. As promised, here’s the [pricing doc / case study / integration guide]. I’ll follow up on Thursday to answer any questions before your team meeting on Friday.”
Speed signals seriousness. If you wait three days, the prospect assumes you’re juggling too many deals to care about theirs.
For teams running multiple demos per day, this is where automation helps—but only if it’s personalized.
Generic “Thanks for your time” emails don’t move deals forward.
Visual Checkpoint: Check your sent folder. Your first post-demo email should have a timestamp within 2 hours of the call.
If it’s consistently 24+ hours later, you’re losing deals.
Verification: Track response rates to your follow-ups. If fewer than 40% of prospects respond to your first follow-up email, it’s either too slow or too generic.
The “Ugly Truth” About Demo-to-Close Rate
Here’s what the generic advice won’t tell you:
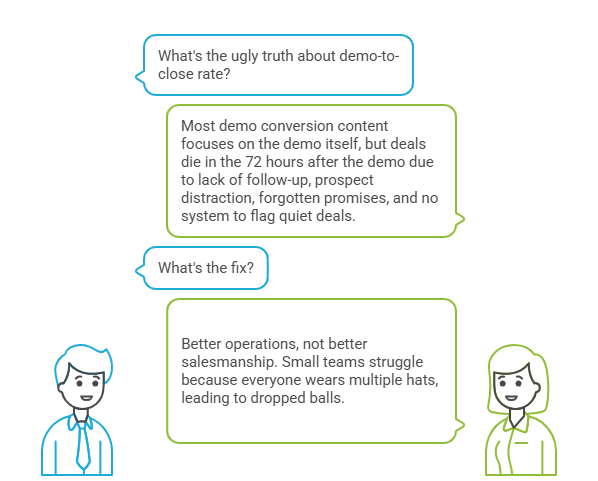
Most “demo conversion” content focuses on the demo itself. Better slides. Smoother discovery. Handling objections.
That stuff matters, but it’s not where deals die.
Deals die in the 72 hours after the demo when:
- No one follows up because it’s unclear whose job it is
- The prospect gets distracted by other priorities
- Your team can’t remember what was promised
- There’s no system to flag when a deal goes quiet
The fix isn’t better salesmanship. It’s better operations.
Small teams especially struggle here because everyone’s wearing multiple hats.
The founder who ran the demo is now in a product sprint.
The AE who was supposed to send pricing is covering customer support tickets.
No one’s intentionally dropping the ball—but the ball gets dropped.
Common “Ghost Errors” and Fixes
| Symptom | Root Cause | Fix |
|---|---|---|
| 40%+ demo no-show rate | Weak pre-demo reminders or low-intent bookings | Use qualification friction to filter leads before they book |
| Prospects ghost after positive demos | No next step defined during the call | End every demo with a booked follow-up meeting |
| Team can’t remember who needs follow-up | Demo outcomes not logged centrally | Log every outcome immediately in one shared system |
| Close rates drop as demo volume increases | Follow-up speed slows when team is busy | Automate first follow-up email, but personalize it |
| Deals stall at “reviewing internally” | No champion or clear timeline | Ask during demo: “Who else needs to be involved? When’s your next internal meeting?” |
FAQ: Demo-to-Close Rate in Practice
How do I calculate demo-to-close rate if some demos take months to close?
Track two metrics: overall demo-to-close (all-time) and cohort-based demo-to-close (e.g., “demos from Q3 that closed by end of Q4”). For enterprise deals with 6+ month cycles, focus on SQL-to-close instead of demo-to-close.
Why is my demo-to-close rate lower than benchmarks even with qualified leads?
Check your follow-up speed and next-step clarity. Even qualified leads go cold if there’s a week of silence after the demo. Also verify you’re comparing apples to apples—PLG companies with activation signals often see 2x higher rates than traditional sales-led motions.
Should I count “no-shows” in my demo-to-close rate?
No. Demo-to-close measures conducted demos. But track no-show rate separately—anything above 20% means your booking process needs stronger qualification.
How can I improve close rate without adding more sales headcount?
Focus on process, not people. Log outcomes immediately. Define next steps before calls end. Review stalled deals weekly. Most small teams have enough pipeline—they just lack visibility into where deals are stuck.
What’s the difference between demo-to-close and SQL-to-close?
SQL-to-close includes all qualified leads, even those who didn’t take a demo. Demo-to-close only measures prospects who actually attended a product demo. For sales pipeline forecasting, track both.
Can demo-to-close rate be too high?
Yes. If you’re closing 60%+ of demos, you’re probably over-qualifying and leaving revenue on the table. Some “maybe” prospects just need more nurturing, not immediate disqualification.
What to Do Next
Demo-to-close rate improves when you treat it like a process metric, not a sales skill metric.
The teams with the best close rates aren’t the ones with the smoothest talkers. They’re the ones who:
- Know which demos are progressing and which are stuck
- Follow up fast with relevant next steps
- Review outcomes systematically instead of guessing
If you can’t answer “What happened to the 8 demos we ran last week?” with specifics, the problem isn’t your product or your pitch. It’s your visibility into what happens after the call ends.
That’s a workflow problem. And workflow problems have workflow solutions.
Start by tracking outcomes for the next 10 demos. Log them immediately. Review them Friday. See where the pattern breaks. That’s where your leverage is.
Stop Guessing Your Close Rate. Start Tracking It.
You can’t improve what you don’t measure. LevelUp Demo automates outcome tracking and follow-ups so you can see exactly which demos convert and why.
✅ Track Outcomes
✅ Automate Follow-Ups
✅ Close More Deals